
In 2019, many different commercial real estate trends in Des Moines influenced the market for commercial real estate buyers and sellers. Paying attention to trends is essential for every savvy multifamily real estate investor. Find out what trends we saw each quarter in our 2019 commercial market review.
Commercial Real Estate Trends in 2019: Q1
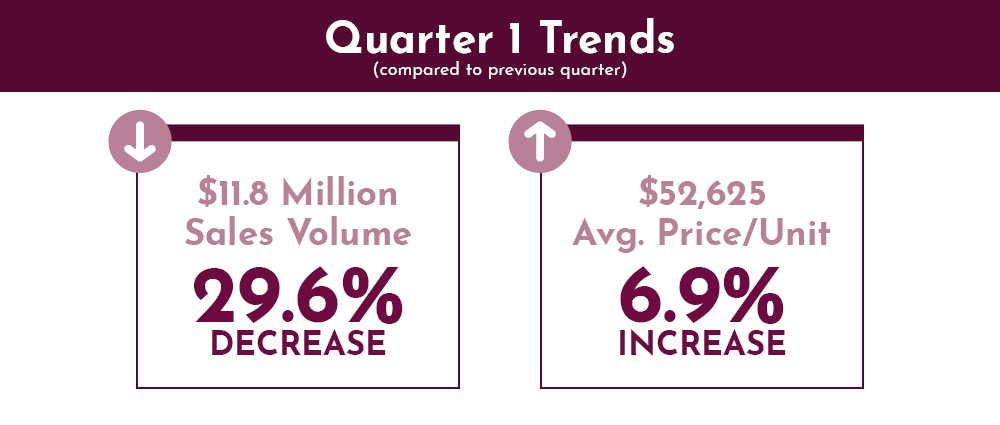
In the first quarter of 2019, we saw the year’s lowest average price per unit across all transactions. Later on, we’ll discuss why the average price per unit is climbing across Des Moines and other Midwest metro areas. Other important takeaways from our 2019 Q1 report include:
Inverted Yield Curve
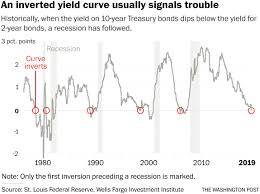
In March 2019, we saw the first inverted yield curve since 2007. An inverted yield curve occurs when investors begin requiring a higher return on their investment within a shorter time frame. Historically, inverted yield curves indicate the potential for an economic recession within 18 months. For the past 45 years, every major recession was preceded by an inverted yield curve.
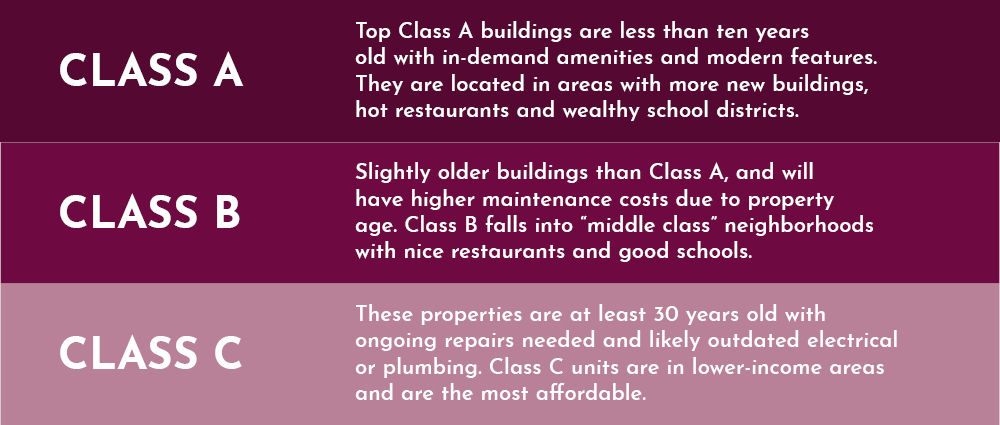
Class B and Class C Units Outperforming Luxury Class A Rentals
Even though developers have built more and more Luxury Class A multifamily apartment buildings in the area, demand for Class B and C units has increased. In spite of the increased earning potential of a newer, nicer apartment building, Class B and C units are still more profitable. The renter-by-necessity demographic is large, and they’re more focused on finding affordable leases, not renting fancy apartments with luxury amenities.
Comparing Commercial Real Estate Trends: Q1 2019 vs. Q1 2018
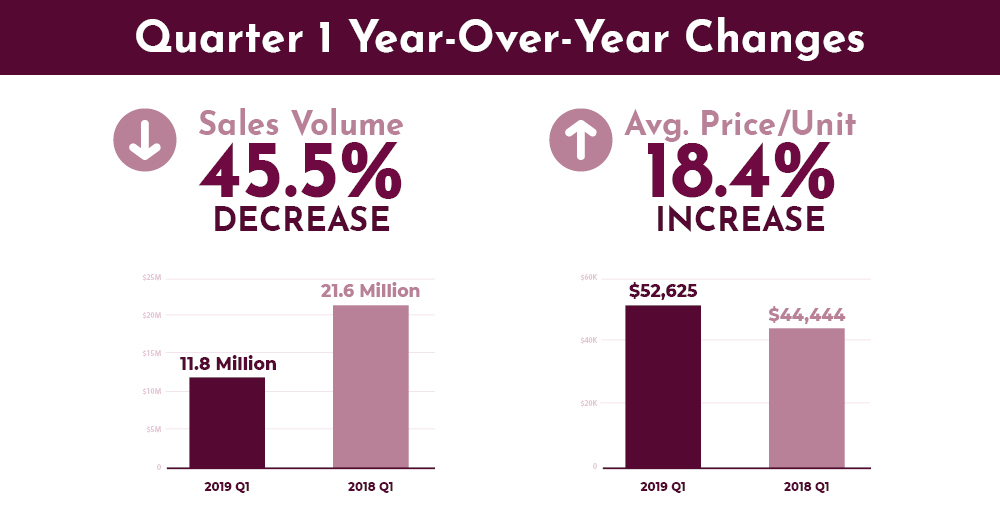
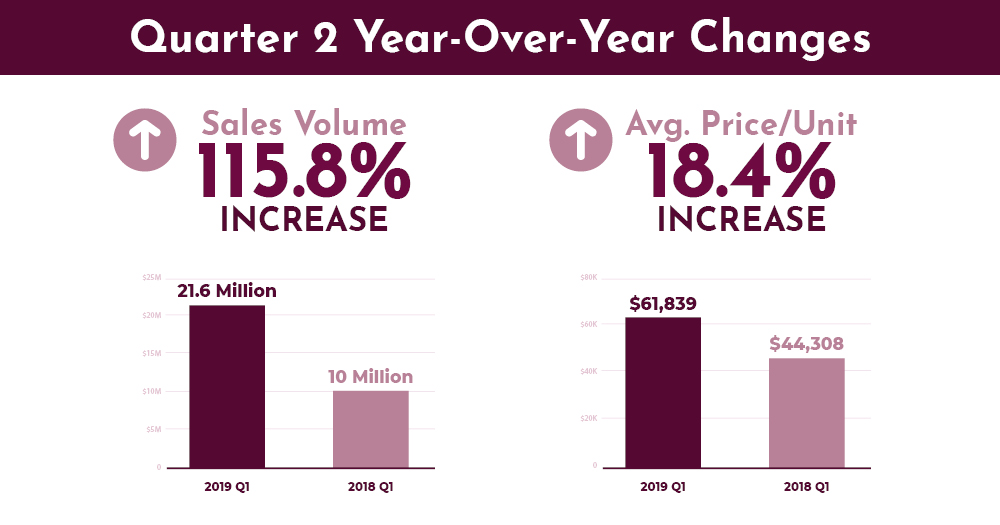
When we compared 2019’s Q1 stats to 2018’s Q1 stats, we saw a decrease in overall sales volume but an increase in average price per unit from $44,444 to $52,625. Average CAP rate remained comparable in the year-over-year comparison.
Commercial Real Estate Trends in 2019: Q2
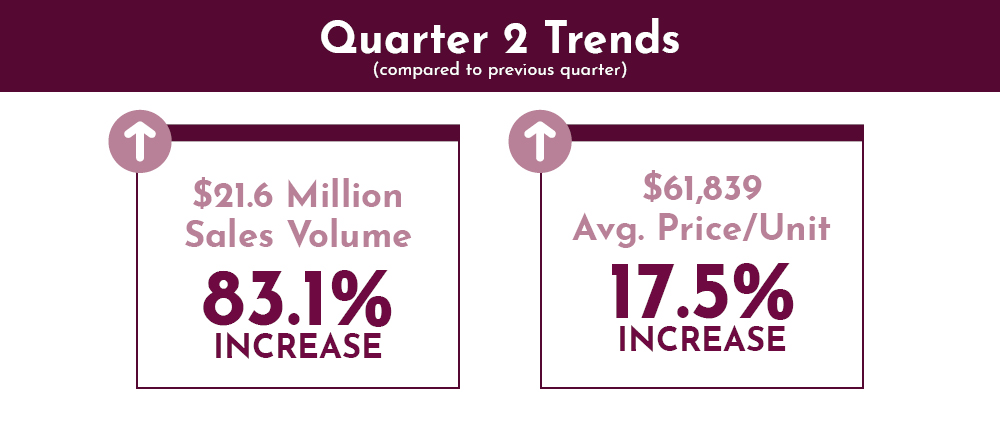
Although Q2 saw the same number of transactions as Q1, Q2 brought an increase in sales volume along with more units sold — 349 units exchanged in Q2 versus just 224 in Q1 — and an increased price per unit. Investors were purchasing bigger buildings with more units, spending more in order to see a higher return on their investment. We noted some other interesting commercial real estate trends in our 2019 Q2 report:
Iowa Thrives in Spite of Economic Concerns
The Iowa economy was on a slight downward trend, with a number of key economic indicators, such as residential building permits and average weekly manufacturing hours, performing poorly. Rent growth slowed to a national average rate of 2.5%, the lowest rent growth rate in the first six months of the year since 2011.
In spite of these economic indicators and slow rent growth, central Iowa continued to draw interest from investors across the nation, and Iowans continued to enjoy one of the lowest unemployment rates in the country, averaging out at 2.4%.
Class C Multifamily Units Experiencing Growth As Homeownership Drops
In Q2, we saw a 0.6% drop in homeownership rates and an increase in demand for Class C multifamily units. Class C units are generally older apartments with few amenities and renovations, and they’re typically located in lower-income areas.
Comparing Commercial Real Estate Trends: Q2 2019 vs. Q2 2018
We see a few differences when we compare Q2 2019 with Q2 2018. Not only did we see a steep increase in total sales volume, but we also saw an increase in average price per unit, similar to our Q1 year-over-year comparison.
Commercial Real Estate Trends in 2019: Q3
At a glance, Q3 statistics look similar to those in Q2. Our transaction count increased by one, and overall sales volume and price per unit experienced a slight increase. However, a few interesting details stood out when we collected our 2019 Q3 report:
Iowa Economy is Neutral
Although determining factors in the Iowa economy continued to trend slightly downward, certain other elements balanced out those negative effects. As autumn and winter approached, fewer building permits were issued. Agricultural markets also experienced a downturn, but the low interest rate environment helped make up the difference. The overall outcome was a neutral economic outlook.
Price Per Unit Driven Up By New Investors
As you may have noticed throughout this report, one of the major commercial real estate trends in Des Moines in 2019 was an increased average price per unit across all transactions. We saw this increase in each quarter, with the exception of Q4 — we’ll discuss Q4 below.
More than half of the buyers in Q3 were located outside of the Des Moines area marketplace. Investors who may typically buy real estate on either coast are taking advantage of low real estate prices in the Midwest. Unfortunately for local investors, newcomers investing in the area often cause inflated property prices because they are typically willing to spend more on commercial real estate.
Comparing Commercial Real Estate Trends: Q3 2019 vs. Q3 2018
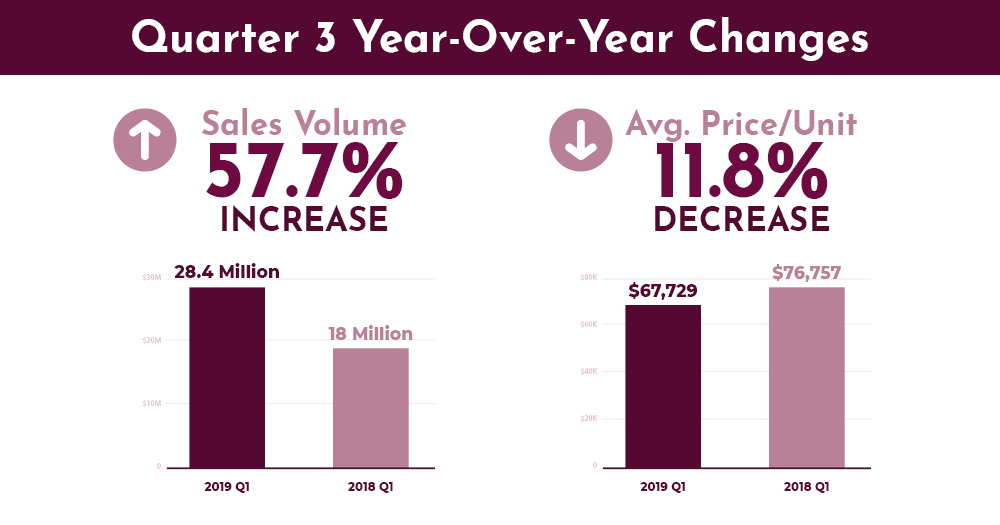
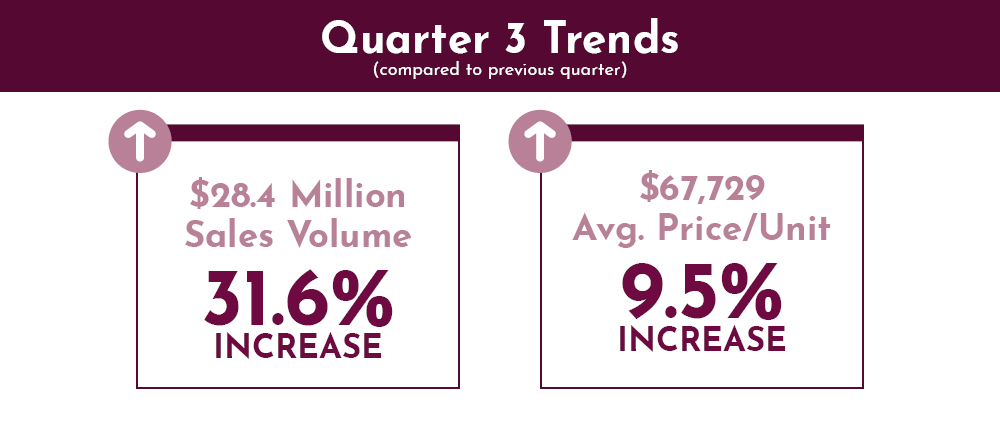
2019’s Q3 saw another leap in total sales volume when compared to Q3 2018. The average price per unit also increased when compared to the previous year’s data.
Commercial Real Estate Trends in 2019: Q4
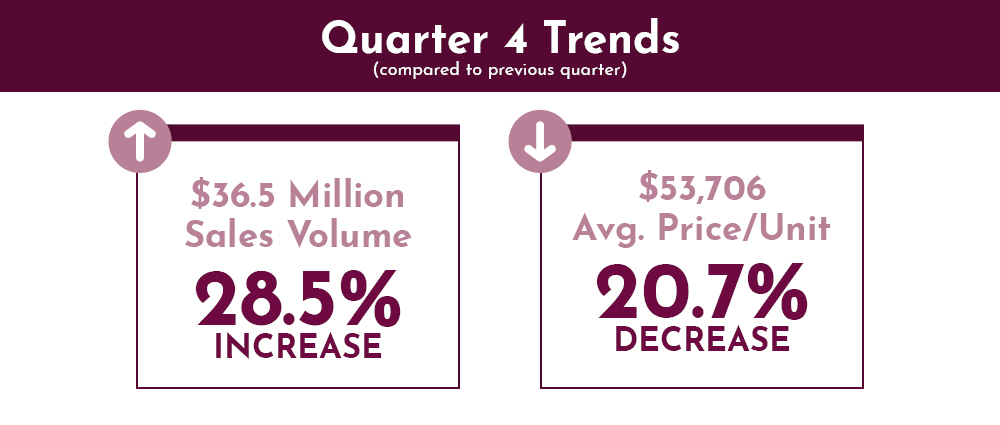
We ended the year strong with our highest overall sales volume and number of transactions. Take a look at other insights from our 2019 Q4 report:
Price Per Unit Down This Quarter
After seeing the average price per unit increase over multiple quarters, this metric dropped lower in Q4. This was due to a majority of sales in the Des Moines metro area and fewer properties purchased in more expensive suburban communities (about a 3:1 ratio in Q4). According to our data, Des Moines area suburbs are selling around $60,000/unit while the Metro is trading closer to $55,000/unit, on average.
2020 Projection: Fewer Development Completions
With the conclusion of Q4, we begin to look to the new year. Commercial real estate trends predicted for 2020 include a decrease in development completions compared to the previous 5 years.
CAP Trended Down Throughout 2019
Throughout 2019, CAP rates trended down. This real estate trend is likely due to cautious investors seeking safer investments. A property’s CAP rate represents the risk an investor takes on when purchasing a property. A higher CAP rate indicates more risk. Learn more about how to buy a property with a good CAP rate.
Comparing Commercial Real Estate Trends: Q4 2019 vs. Q4 2018
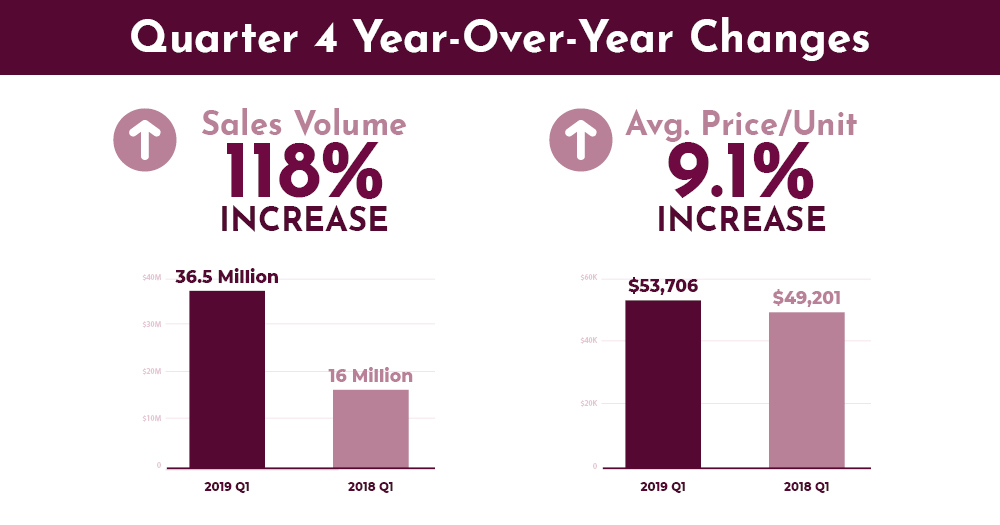
When we took a look at our Q4 2019 data and compared it to our Q4 2018 commercial market review, we saw a 118% increase in sales volume — the largest year-over-year increase of any statistic we recorded! Q4 2019 also saw an increase in average price per unit when compared to the same quarter in 2018.
Contact Us to Learn More About Des Moines Commercial Real Estate Trends
If you’d like to learn more about commercial real estate trends in Des Moines, or if you’re wondering how to use these 2019 commercial market review insights to optimize your investment strategy, reach out to our experts! We’re here to be your real estate investing resource. Browse our current listings or get in touch.