

Thoughts From Jared
A new year always brings change — and in commercial real estate, change isn’t just expected; it’s the fuel that drives opportunity.
Looking back, 2025 delivered more than its share of “new” to Iowa’s multifamily market. New investors—including international buyers — entered the scene. We saw record-breaking transactions, deal volume, and price points. It felt like every quarter brought another wave of unprecedented movement (as we noted in our last report).
But here’s the thing about “new”: it’s exciting, yes — but also uncertain. The discovery of the New World sparked innovation and expansion, but in the moment, it raised far more questions than answers. That’s where we are now. What does international capital mean for Iowa in the long run? How will new technologies like AI reshape our industry? And most importantly — where in the cycle are we?
This report unpacks Q4 2025 and the full-year trends that shaped the multifamily landscape across Central Iowa. But we’re not stopping there. We’re zooming out — 36,000 feet out — to search for patterns, parallels, and clues from past markets. We’re asking better questions to help forecast what’s ahead and offering perspective to help you navigate the shifting terrain.
Let’s dig in and explore where the market’s been—and where we may be headed next.


Executive Summary
What Does this Report Say in Less than 3-Minutes?
Central Iowa Apartment Market Q4-2025 Performance
- Sales Volume: $133.36 Million Sales Volume
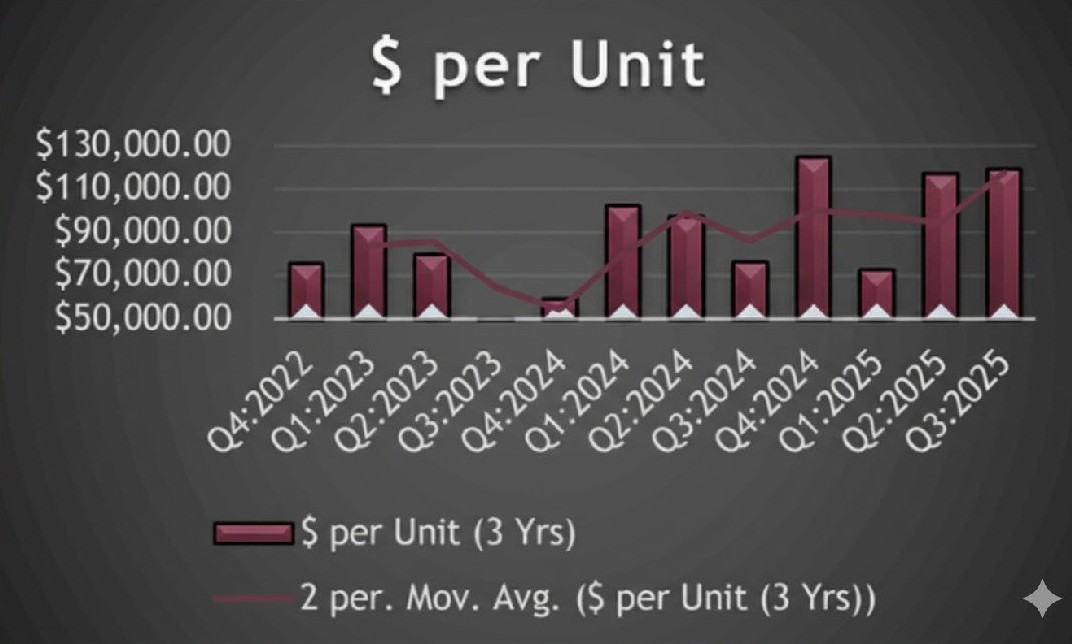
- Price Per Unit: $118,648
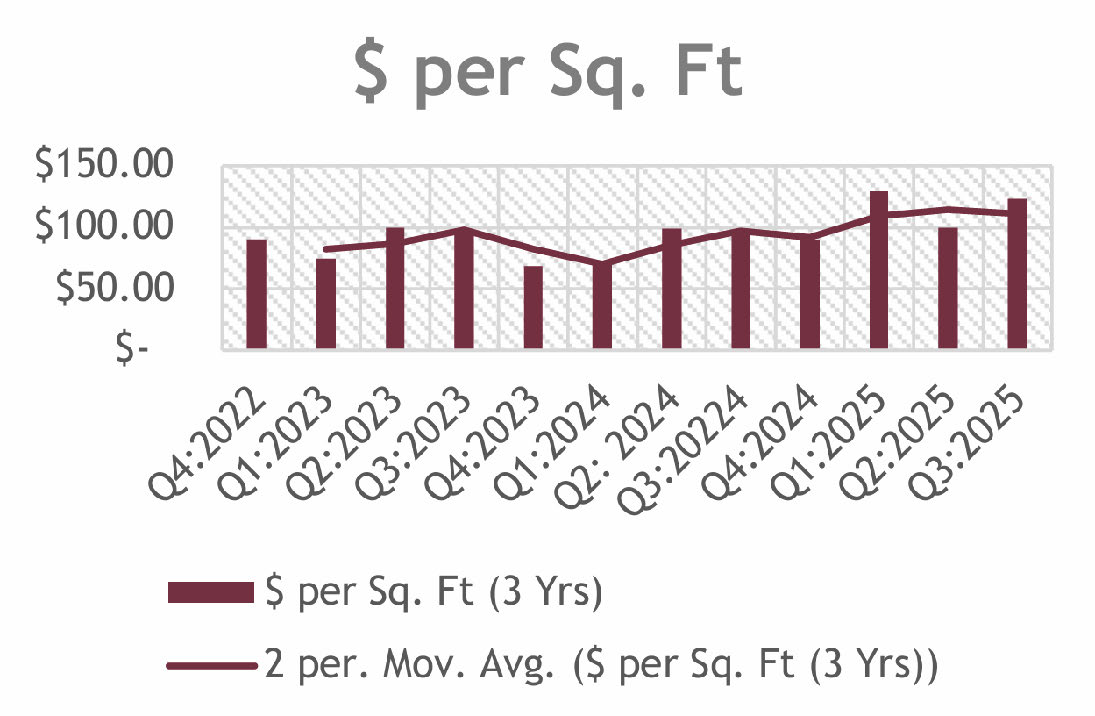
- Price Per Square Foot: $104.69
- Cap Rate: %
Central Iowa Apartment Market 2025 Performance
- Sales Volume: $831.23 Million Sales Volume
- Price Per Unit: $103,653
- Price Per Square Foot: $110.60
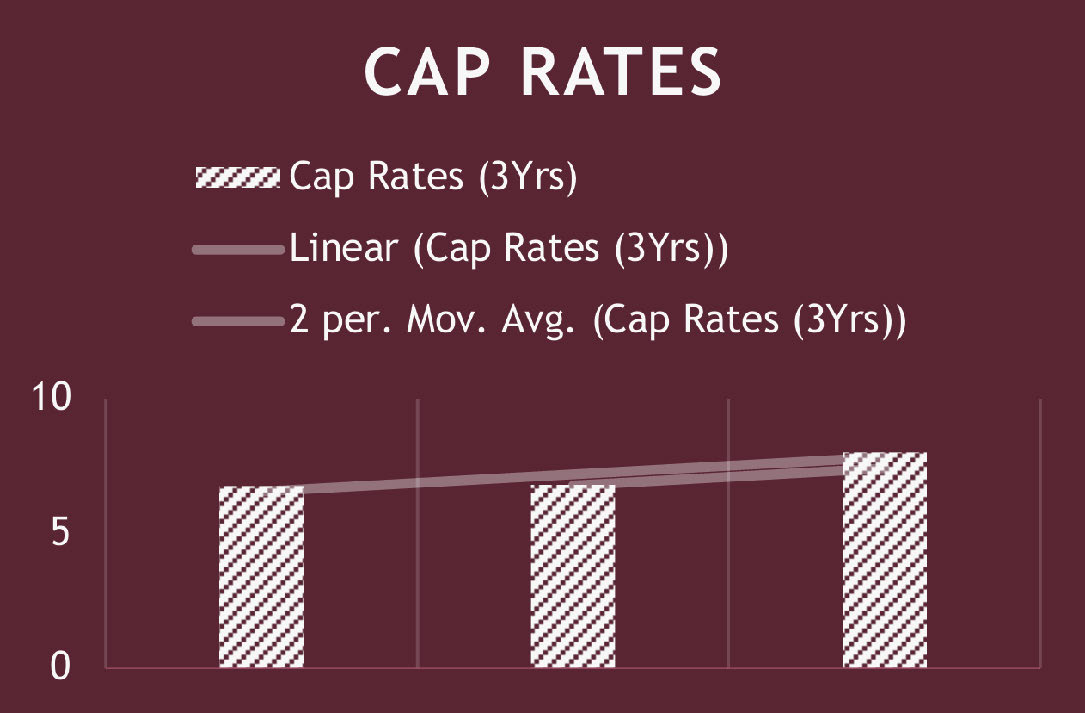
- Cap Rate: 6.89%
Des Moines Multifamily Market Insights
- Occupancy Rate: 91.0%
- Rent Growth: 1.2% Year-over-Year
- Development: 1,678 Units under construction, down almost 50% from last year as vacancy and low rent growth hinder new development pro-formas.
Three Things to ALWAYS Consider…
- Buying Opportunities:
If you are looking for opportunities, 1960-1970 apartments are trading at 60%-70% of the average prices and more than 50% compared to new apartments and cost to replace. The challenge will be insurance and financing but if you can solve these solutions there seems to be a buying opportunity currently. - Holding & Refinancing:
Shop around to different lending institutions, many banks are tightening credit while a few continue to see Des Moines as a strong environment to lend. - Selling or Disposing:
If you own newer assets (newer than 1980) there is a strong opportunity to sell currently as that is the new “In-Style” asset. Older assets are struggling to get financed and insured and only sell these assets WITH a strong 1031 in-place OR a strategy.
Questions I am Asking:
- Buyers: If I can upgrade the older assets to new quality to get insurance and financed, could I get 80% of the rents new complexes achieve? Do I have enough capital to fund these large CapEx items?
- Sellers: How long can Des Moines continue to achieve record sales prices and sales volume while many other cities and states struggle with rental growth and vacancy?
The Iowa Market Summarized in Two Sentences…
In 2025 we broke new records of Sales Volume and we began to attract international investors and it appears that the multifamily market is in a K-Shaped economy.
Central Iowa Multifamily
How Did Central Iowa’s Apartment Market Perform Last Quarter?
We had an active 4th quarter fifth 18 sales over 15 transactions culminating in $133.36 million of sales volume. This wraps up a record year for Central Iowa multifamily coming in at over $831+ million of sales; surpassing our previous record of $512 million. Much of this is due to the largest sale in history of 1,610 units for $183 million; however, worth noting is that even without this large sale, Central Iowa would STILL have seen a record year of sales volume. As we look at the stats and reviewing conversations daily with clients the question that comes to mind is: Are we experiencing a K-Shaped economy?
What trends did WE identify in the Statistics?
- 10 of 18 Sales were A-Class quality with average prices far surpassing the averages; 8 of the 18 were C-Class quality assets at 50%-70% of the average prices seen in the 4th Quarter.
- In 2025 we saw 7.4% of all apartment inventory sell and 2.9% of all buildings were sold; this indicates that larger properties continue to sell compared to previous years as the percent of inventory is higher than normal while the percent of building inventory is in-line with market
How will these trends affect:
- Buying or Acquiring?
- There appears to be opportunity to purchase older and C-Class assets at below market averages.
- For buyers looking at the A and B-Class assets, operations will be the key to a successful transaction.
- Holding or Refinancing?
- Interest rates have hit their lowest for the foreseeable future of 2026 with 1-2 rate cuts expected at most.
- Selling of Disposing?
- For properties newer than 1980 and 100+ units it may be an opportune time to sell. For older C-Class assets pricing may not be reflective of seller’s goals.

Iowa Economy
How do we track the Iowa Economy?
Over the last 6-months it appears that the Iowa economy has gone neither up, nor down with the Leading Indicators Index almost identical to June 2025. Looking at the prior 1-2 years it appears that Iowa has had modest growth of 1%-2% and so, while the indicator is above 100 (normally a good sign) when the last 6- months is looked at over a 2-year period we can see a “cooling off” within the overall Iowa economy.

What I’m Watching?
With 2025 being a record sales volume year I am strongly watching the large institutions who have purchased in Des Moines in 2020-2022; how these properties have operated over the past 5-years will be a clue to see how the latest out of state (and out of country) investments will most likely perform over the next 3-5 years.
What I’m Hearing?
Banks are continuing to be tight with capital and underwriting metrics especially coming into the new year. This is creating a credit squeeze amongst most individuals and small businesses.
What I’m Seeing?
I believe many banks are looking ahead to 2026 and 2027 preparing for write-downs or REO properties as 5 and 7 year rates mature which is what is leading them to be more stringent on lending, especially in C-Class multifamily assets which have not performed as was originally underwritten at the time of acquisition.
National Economy
What is Happening Nationally In the Multifamily Market?
As we push into and through the Winter season, 29 of the 30 markets tracked showed rental decline with rents averaging $1,740 across the nation and only up 0.2% over the year (down from earlier in the year when rental growth was closer to 0.7%). Most of the rent growth is occurring in New York and Chicago where inventory is tight and new developments become challenging due to regulations.

What are Some Trends Nationally?
With the government shutdown, data points have become tricky to review and underwrite for the national economy; however, in conversations with CCIM’s and agents across the country I am hearing of: No rent growth, 10% vacancy is normal, and many investors who bought in 2021-2023 are writing off their equity positions and selling at 65%-75% of purchase prices.

How do you Profit?
- Buying or Acquiring?
- While there is a short-term trend of low rent growth, high vacancy, and REO properties; long-term the US is still underbuilt and we are facing a housing shortage. If your goal is long-term wealth accumulation now may be a good buying opportunity.
- Holding or Refinancing?
- Shopping across multiple banks will be important as banks project potential losses on their books in 2026-2027.
- Selling or Disposing?
- If your asset is newer than 1980 and over 100+ units there are many buyers active looking for properties like yours; additionally, smaller properties under 16 units continue to attract buyers and now may be a good time to consider a sale.
What have WE been Selling and LYSTing JUST in 2025?


ACTIVE

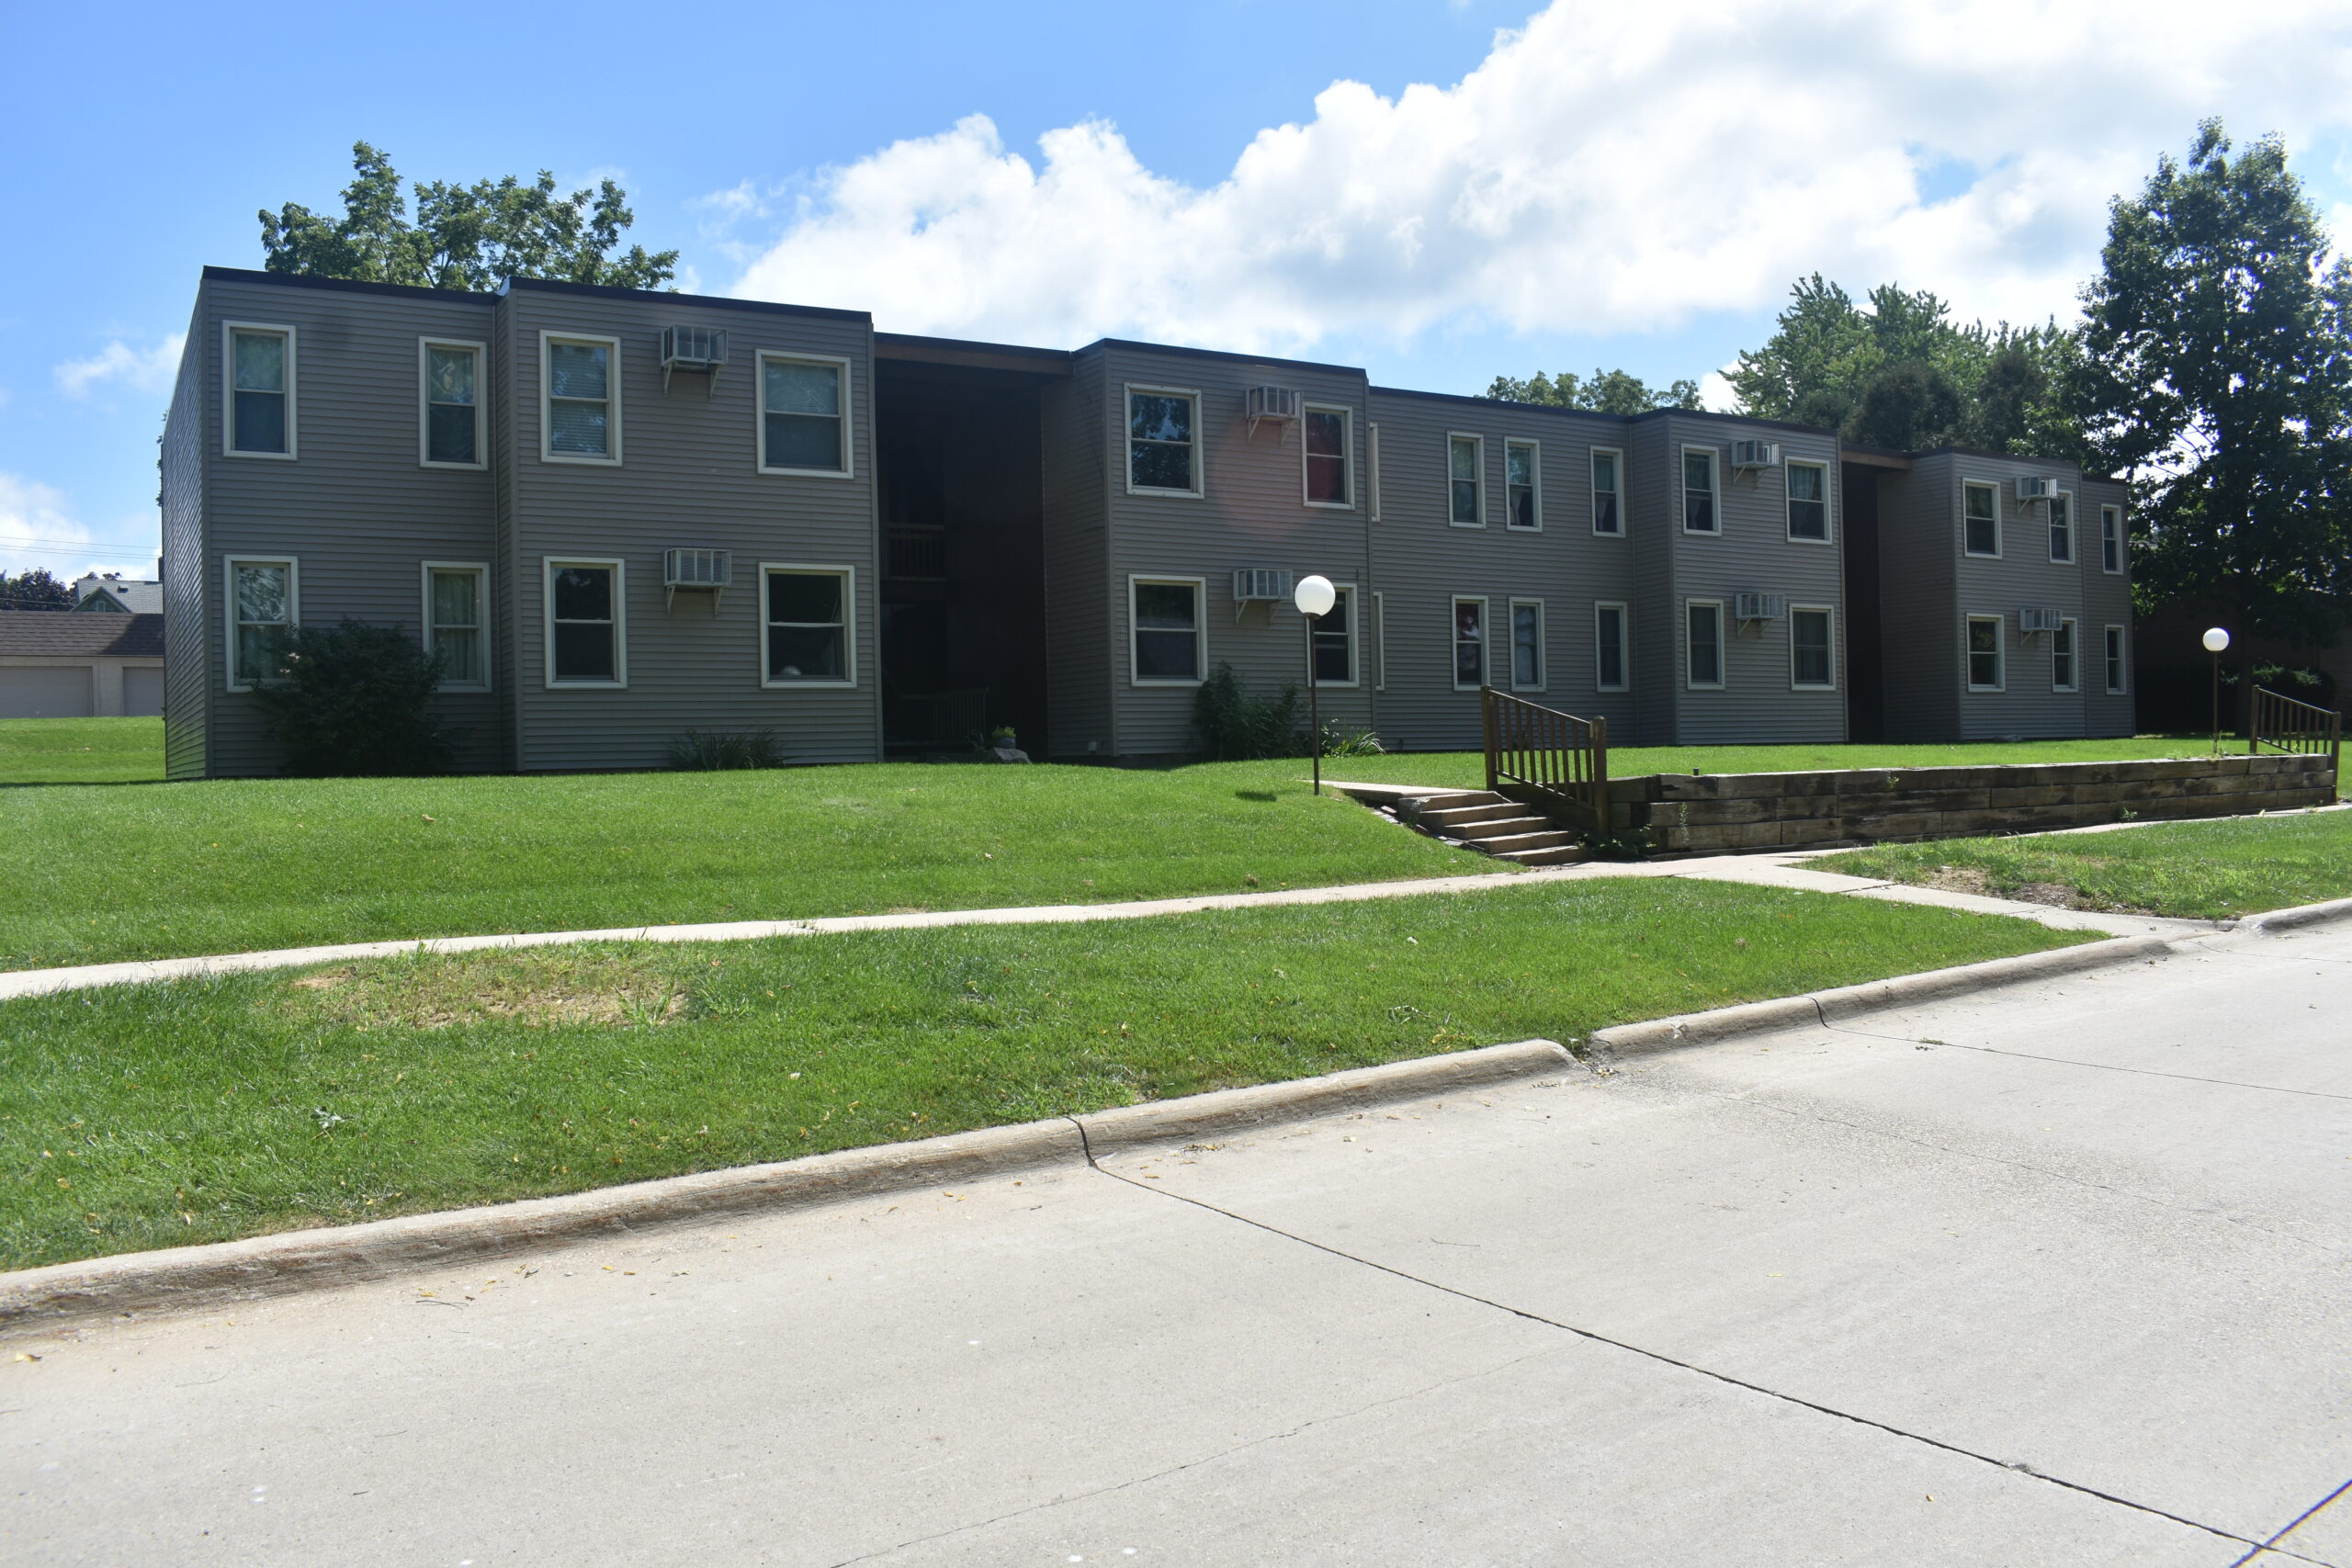
600 8th St SW, Altoona, IA

SOLD
104 Arden St, Waterloo, IA
For more information on Listed, Sold, or Sale Pending properties please contact me! Thank you.
Disclaimer
Provider is a licensed real estate agent and has the rights to sell real estate in the state of Iowa.
All information was obtained via 3rd parties including but not limited to Yardi Matrix, Iowa-Leading Economic Indicators, CoStar, and more. All effort was made to ensure the accuracy, timeliness, and completeness of information provided for publication. KW Commercial does not guarantee, warrant, or represent that all information is accurate or complete and is not liable for any loss, claim, or demand arising from the direct or indirect use or reliance upon information provided.
Behind the Desk
Jared is a 3rd generation real estate entrepreneur growing up with a grandfather who was a homebuilder and investor; a father who was an electrician, developer, and investor; and a mother who was a residential investor, manager, and bookkeeper. With this extensive knowledge as well as being an owner himself for over 15+ years and involved in over 200+ individual transactions he has extensive experience in; financing, operations, management, development, construction, bookkeeping, brokerage, and entrepreneurial activities.
Having helped clients purchase and sell over $100+ Million of real estate personally as an agent-advisor Jared has helped his average client earn over 26.95% rate of return on their real estate investments.
In his spare time has has many hobbies which include but are not limited to: traveling, mountain climbing, hiking, piano, ballroom dancing, Latin dancing, pilot, Spanish lessons, and is always looking for a new adventure.