


Thoughts From Jared
“I should think you Jedi would have more respect for the difference between knowledge and wisdom.”
— Star Wars
This quote has been rattling around in my head over the past few days as I’ve prepared this report. It also reminds me of recent conversations I had with both my coach and one of my coaching clients. With the rise of AI, knowledge has become a commodity. It is now something nearly everyone has access to. With only a few clicks and a handful of questions, we can access more information than any previous generation could have imagined. Knowledge alone no longer sets us apart. Wisdom does.
Knowledge tells us what is happening. Wisdom helps us understand why it matters and what to do next.
I’ve been reminded of that truth as we sit near one of the lowest points in the current real estate cycle. I often think back to conversations I had with several experienced investors during the 2021–2022 boom. While the data, headlines, and market momentum all pointed toward ever-rising prices, many of them simply shrugged and said, “This doesn’t make sense.” Their wisdom challenged the facts everyone else was celebrating. Looking back today, their perspective seems almost prophetic. Hindsight may be 20/20— but wisdom often sees what statistics cannot.
Since transitioning from owner to commercial real estate advisor, I have tried to be more than someone who simply presents data. My goal has always been to serve as a trusted advisor and offer whatever wisdom my own successes—and just as importantly, my failures—have taught me. I certainly don’t have all the answers. In fact, I’ve been wrong more times than I care to admit.
However, after more than a decade of tracking the Iowa multifamily market, studying economic cycles, and analyzing thousands of transactions, I believe the next 6 to 24 months could prove to be the most challenging period many investors have experienced since 2008–2009.
For the past several years, much of the market has operated in a “wait-and-see” mode. Many owners have been able to pretend and extend—hoping interest rates would quickly decline, valuations would recover, and the difficult decisions could be postponed. That period appears to be coming to an end.
Today, difficult decisions are becoming unavoidable. Pricing expectations must adjust. Rent growth is slowing. Expenses continue to rise. Profit margins are tightening. Success in this environment will depend less on having access to information and more on exercising sound judgment.
As you read this report, I would encourage you to ask yourself one simple question:
“Am I simply reviewing facts… or am I searching for wisdom?”
Because facts inform us. Wisdom prepares us.
And in markets like these, wisdom is almost always the better investment.


CENTRAL IOWA STATISTICS AT A GLANCE – Executive Summary
Q1 2026
18 closed sales
$103.6M total volume
Avg $/Unit: $89,959 · Median $/Unit: $80,000
Avg Cap Rate: 6.66%
Q2 2026
9 closed sales
$27.7M total volume
Avg $/Unit: $99,659 · Median $/Unit: $66,818
Avg Cap Rate: 6.66%
DSM Pricing by Building Class · 2026 YTD
| Class | #Sales | Avg $/Unit | Median %/Unit | Avg Cap Rate | Note |
|---|---|---|---|---|---|
| A | 4 | $180,736 | $171,349 | 5.68% | New construction ceiling being established |
| B | 8 | $92,076 | $81,028 | 6.82% | Office Park Rd. ($78,889) reinforces range |
| C | 13 | $67,840 | $61,042 | 7.47% | Insurance & finance remain primary friction |
Cap Rate Trend · DSM Market ·Annual Median
| 2018 | 2019 | 2020 | 2021 | 2022 | 2023 | 2024 | 2025 | 2026* |
|---|---|---|---|---|---|---|---|---|
| 8.85% | 7.53% | 7.83% | 6.63% | 6.68% | 7.25% | 6.49% | 6.63% | 7.44% |
THREE THINGS TO CONSIDER · Q2 2026
BUYING · ACQUIRING
- Consider the new Tax Laws passed in Iowa and underwrite in your model.
- Be willing to be “contrarian” in buying today, vintage C-Class may be the best deal if you can successfully operate it.
HOLDING · REFINANCING
- With weak rental growth and inflation elevated, management and operations will be vital to success.
- Know the “Soft” costs of operation and how to reduce them.
Selling or Disposing:
- Listings YTD are up almost 200%, consider the competition when selling.
- Selling now ONLY makes sense with a plan in-place, ensure you are working with the right professional.
QUESTIONS I AM ASKING · Q2 2026
BUYERS
Do you have experience managing the operations and project management AND what is your detailed plan to negate the headwinds currently?
SELLERS
Are you able to hold or stabilize this asset over the next 6-18 months in order to get a better price?
Active Inventory VS Sales Volume:
| Market | Active Lists | Active Units | Avg List $/Unit | Q2 Sales | Q2 Volume | Avg Sold $/Unit | Avg Cap |
|---|---|---|---|---|---|---|---|
| DSM | 11 | 357 | $80,517 | 9 | $27.7M | $99,659 | 7.44%* |
| Rural | 9 | 234 | $135,195 | 2 | $3.6M | $52,865 | 9.04%** |
| Quad Cities | 6 | 156 | $55,965 | 1 | $1.7M | $70,000 | – |
| Sioux City | 3 | 157 | $177,083 | 0 | – | – | – |
| Waterloo | 2 | 35 | $56,042 | 0 | – | – | – |
| Cedar Rapids | 1 | 30 | $63,333 | 0 | – | – | – |
| Iowa City | 0 | – | – | 1 | $10.5M | $152,174 | – |
MARKET COMMENTARY
DSM
DSM recorded 9 transactions in Q2 for $27.7M in volume which is significantly down compared to Q1: 2026 where we saw 18 transactions totaling over $100+M in volume. Furthermore, we continue to see the K-Shape in pricing with A-Class assets trading at 200%-300% compared to B-Class and C-Class assets.
Rural Iowa
Rural Iowa was the most active market for new supply in Q2, with three 2025-built Class A properties asking $141K–$240K/unit. Two Q2 closings — West Burlington ($58,229/unit, 9.04% cap, the only confirmed rural cap rate) and Keokuk ($47,500/unit) — represent the older end of rural inventory and illustrate a stark difference between new construction asking prices and actual rural comps. The question we are still facing is if buyer’s will pay these higher prices in rural markets.
Iowa City
Iowa City’s tracker debut — 2517 Sylvan Glen Court, 69 units, 1980-built Class C, $10.5M ($152,174/unit), brokered by Greysteel, this is the quarter’s most strategically significant data point. Institutional broker presence and pricing well above DSM Class C comps indicates differentiated demand tied to the university-driven rental market.
Cedar Rapids
Cedar Rapids is seeing some movement with listings averaging $63,333/unit at a 6.9% listed cap rate. We have not statistically confirmed any sales yet in Cedar Rapids for the 2nd Quarter of 2026 though.
Quad Citites
Six active listings, 156 units. One Q2 sale: 3547–3553 Heatherton Dr., Davenport — 24 units, 1975-built Class C, $70,000/unit, 98.8% list-to-sale, CBRE on both sides. Near-par execution on a C-class property suggests thin but functional demand for stabilized workforce housing in the QC market.
Sioux City · Waterloo
Both markets remain quiet with no Q2 closings. Sioux City carries 3 active listings (157 units), including two broker-marketed exclusives with no listed price. Waterloo has 2 active listings (35 units). Both markets will require sustained deal flow before meaningful conclusions can be drawn.
IOWA ECONOMY – Q2 2026
Iowa Leading Indicators Index (ILII) ·February – April 2026
| Month | ILII | Mo. Change | Diffusion Index | 6-Mo. Ann. Rate | Key Signal |
|---|---|---|---|---|---|
| Feb 2026 | 108.1 | +0.04% | 62.5 | +0.80% | 4 of 6 available components ↑; mfg hrs & permits unavailable (federal shutdown) |
| Mar 2026 | 108.1 | +0.01% | 68.8 | +1.00% | 5 of 8 components ↑; Iowa nonfarm employment declined 0.09% — 17 of last 18 months |
| Apr 2026 | 108.3 | +0.20% | 87.5 | +1.40% | 7 of 8 components ↑ — strongest breadth reading of Q2; permits rebounded +27.1% vs Apr 2025 |
What the ILII Is Telling Us · Q2 2026
The most important story in the Q2 ILII data is the April acceleration. After two months of essentially flat readings (108.1 in both February and March), the index jumped to 108.3 in April with 7 of 8 components rising — the strongest monthly breadth reading of the quarter. That breadth matters more than the 0.2% monthly change itself: it signals broad-based expansion, not a one component spike.
The six-month annualized growth rate has climbed steadily from +0.8% in February to +1.4% in April — moving in the right direction, though still far short of the -2.0% threshold that would signal contraction risk. Iowa’s economy is not decelerating; it’s grinding forward.
Two persistent tensions in the data deserve attention. First, Iowa nonfarm employment has declined in 19 of the last 20 months — a sustained employment-coincident softness that coexists with the leading index staying above 100. This divergence suggests the economy is growing slowly but hasn’t translated into net job creation. For multifamily operators, that matters: tepid employment growth limits rent upside. Second, residential building permits rebounded sharply in April (+27.1% vs. April 2025), reversing months of decline. New permit activity is a leading indicator for future supply — watch whether this rebound sustains into Q3.
Iowa Economic Indicators · Q2 2026
| Month | Reading | As Of | Source | Implication |
|---|---|---|---|---|
| Iowa Unemployment Rate | 3.2% | May 2026 | Iowa Workforce Dev. | ↓ from 3.6% YOY — tightest labor market in 3 years |
| US Unemployment Rate | 4.3% | May 2026 | BLS | Stable; within CBO full employment range |
| Iowa LFPR | 67.4% | May 2026 | Iowa Workforce Dev. | One of highest participation rates nationally |
| 10-Year Treasury | 4.40% | Jun 25, 2026 | US Treasury | Cap rate spread vs. multifamily remains narrow |
| Iowa ILII | 108.3 | Apr 2026 | Iowa Dept. of Revenue | 6-mo. annualized: +1.4%; above 100 = expansion; no contraction signal |
What I’m Watching · What I’m Hearing · What I’m Seeing
WATCHING
- Iowa property taxes; what is the real burden?
- Inflation numbers; how will this affect real operations?
- Interest rates; at the core this is driving the market right now.
HEARING
- While property taxes are only supposed to rise 6% over two years, the net affect will be closer to 14% increase.
- Many owners are starting to come up against debt refinances.
SEEING
- Listings continue to outpace closings across Iowa.
- Foreclosed properties and challenges are hitting ownership groups.
NATIONAL ECONOMY · MULTIFAMILY MARKET – Q2 2026
National Multifamily
| 2.2% GDP Growth (2026E) Deloitte / BEA | 4.3% US Unemployment BLS · May 2026 | 4.40% 10-Year Treasury US Treasury · Jun 25 | $1,767 National Avg Asking Rent Yardi Matrix · May 2026 |
| +0.2% Nat’l YOY Rent Growth Yardi Matrix · May 2026 | $26.6B MF Investment Volume YTD Yardi · 5-mo 2026 | ~1.3M Units in Lease-Up Yardi Matrix · Jun 2026 | ~469K 2026 Completions Forecast Yardi Matrix |
National Multifamily Narrative
The national multifamily market entered Q2 2026 in a state Yardi Matrix describes as “modest but constrained.” National average asking rents reached $1,767 in May 2026, representing just 0.2% year-over-year growth — historically weak, though seasonal momentum has kept monthly gains slightly positive since January. Yardi’s summer 2026 outlook warned that “full-year growth is likely to be limited” as nearly 1.3 million units remain in the lease-up phase, sufficient to overwhelm demand even as construction starts decline.
The regional divergence story is the most important narrative for Iowa operators: Midwest and Northeast gateway markets — San Francisco (+4.5%), Chicago (+3.5%), New York (+3.3%), Kansas City (+2.8%) — are leading national rent growth precisely because they have limited new supply. Sun Belt markets continue absorbing overbuilding: Austin (-5.8%), Phoenix (-2.1%). Iowa sits in a favorable relative position, though its tepid population growth continues to cap rent upside.
On the capital markets side, deal volume through the first five months of 2026 clocked in at $26.6 billion — down 10.7% year-over-year — not from lack of capital ($174 billion raised for U.S. multifamily acquisitions on a two-year basis through March 2026), but because sellers are waiting for bid-ask gaps to narrow as mortgage rates continue declining. Quality Midwest product with stable NOI may see earlier buyer activation than Sun Belt distress plays.
Metro Rent Growth Leaders · May 2026 (Yardi Matrix Top 30)
| Rank | Metro | YOY Rent Growth |
|---|---|---|
| 1 | San Francisco, CA | +4.50% |
| 2 | Chicago, IL | +3.50% |
| 3 | New York City, NY | +3.30% |
| 4 | Kansas City, MO | +2.80% |
| 5 | Boston, MA | +2.50% |
| 6 | Minneapolis–St. Paul, | +2.10% |
| 7 | Miami, FL | +1.40% |
| 8 | Des Moines, IA* | ~+0.6% |
| 9 | Phoenix, AZ | -2.10% |
| 10 | Austin, TX | -5.80% |
HOW DO YOU PROFIT? · NATIONAL CONTEXT
BUYING · ACQUIRING
- Nationally ~1.3M units in lease-up creates Sun Belt distress — REO and note sales are beginning.
- Iowa isn’t distressed, but buyer capital chasing Midwest stability is real and growing.
- Long-term the US is still in undersupply for housing and if you can look past the next 3-5 years you can find value.
- Iowa’s B-class middle market offers risk-adjusted value that institutional buyers are beginning to target.
HOLDING · REFINANCING
- 10-Year Treasury at 4.40% as of June 25, 2026. Cap rate spread vs. multifamily remains narrow — real refinancing pain for anyone who purchased in 2021–2022.
- Lenders are returning to construction lending (GSEs, banks) but underwriting standards are higher. DSCR matters more than ever.
- NOI protection through strong operations is the single most leverageable variable for hold/refi scenarios in this rate environment.
Selling or Disposing:
- Institutional buyers are still chasing the Midwest especially in the A-Class and B-Class marketplace.
- Quality Midwest assets — stabilized, 50–150 units, post-1980 — are positioned to transact and will drive the highest pricing today.
- Sellers of distressed assets must price for today’s underwriting, not 2021 valuations. Bid-ask gap is the primary impediment to volume nationally.
Q2 2026 CLOSED SALE COMPS · DSM MARKET · KATALYST TRACKER
| Market | Address | Units | Class | Cap Rate | Sale Price | $/Unit | Broker | Notes |
|---|---|---|---|---|---|---|---|---|
| DSM – WDM | 910 9th St. | 11 | B | – | $735,000 | $66,818 | Unknown | B-class WDM comp |
| DSM – Mitchellville | 113 2nd St. NE | 8 | C | 7.93% | $472,000 | $59,000 | Stanbrough | Confirmed cap rate |
| DSM – Des Moines | 6920 SW 9th St. | 12 | C | – | $732,500 | $61,042 | CBRE | C-class DSM floor |
| DSM – Ames | 316 Hayward Ave. | 33 | A | 6.95% | $5,900,000 | $178,788 | Triad (both) | Student; Stritzel Apts — confirmed cap |
| DSM – WDM | 800 13th St. | 12 | C | – | $1,220,000 | $101,667 | Remax Concepts | 6-mo DOM from Nov 2025 listing |
| DSM – Johnston | Ridgedale Heights | 12 | A | – | $2,900,000 | $241,667 | Unknown | Off-market new construction — OUTLIER |
| DSM – Des Moines | 2920 Douglas Ave. | 10 | C | – | $495,000 | $49,500 | Unknown | C-class DSM floor comp |
| DSM – WDM | 1155–1175 Office Park Rd. | 90 | B | – | $7,100,000 | $78,889 | Unknown | Most recent closing Jun 17; B-class WDM |
Total Q2 Volume: $27,654,500 | Total Q2 Units: 324 | Avg $/Unit (all 9): $99,659 | Median $/Unit: $66,818
ACTIVE LISTINGS SNAPSHOT
Selected active listings from KataLYST tracker across all Iowa markets. Full listing detail: contact Jared directly.
| Market | Property | Units | Class | List Cap | List Price | List $/Unit | Listing Firm |
|---|---|---|---|---|---|---|---|
| DSM | 3909 Hubbell Ave. (Cyprus 1) | 54 | C | 6.21% | $4,625,000 | $85,648 | Marcus & Millichap |
| DSM | 4214 Hubbell Ave. (Cyprus 2) | 54 | C | 6.21% | $4,625,000 | $85,648 | Marcus & Millichap |
| DSM | 920 Meadow Ln. (Valley Acres) | 102 | C | 7.58% | $5,900,000 | $57,843 | CBRE |
| DSM | 325 SW 7th St. | 29 | A | – | Offered | – | CBRE |
| DSM | 1620 Vine St. WDM | 16 | C | – | $1,900,000 | $118,750 | NAI Iowa |
| DSM | 4004 University Ave. | 8 | C | 5.71% | $640,000 | $80,000 | NAI Iowa |
| DSM | 4671 NW 50th St. | 11 | C | 4.07% | $775,000 | $70,455 | CBRE |
| Rural | 1833 Curtis Ave. (Chariton) | 52 | A | 6.74% | $6,000,000 | $115,385 | Stanbrough |
| Rural | 210 Wilson St. (Van Meter) | 10 | A | 6.21% | $2,400,000 | $240,000 | Coterie RE |
| Rural | 602 Creekside Ln. (Marshalltown) | 24 | A | 6.80% | $5,600,000 | $233,333 | Stanbrough |
| Rural | 605 E. 1st St. (Monticello) | 12 | A | 6.50% | $1,700,000 | $141,667 | Stanbrough |
| Cedar Rapids | 802–816 15th Ave. SW | 30 | C | 6.90% | $1,900,000 | $63,333 | Mr. Landman |
| Quad Cities | 1203 E. 11th St. (Davenport) | 44 | C | 7.32% | $2,550,000 | $57,955 | Marcus & Millichap |
| Sioux City | 1720 Morningside Ave. | 24 d | A | – | $4,250,000 | $177,083 | NAI United |
| Waterloo | 1110 Doreen Ave. | 12 | C | – | $745,000 | $62,083 | Realty One |
What have WE been Selling and LYSTing JUST in 2026?

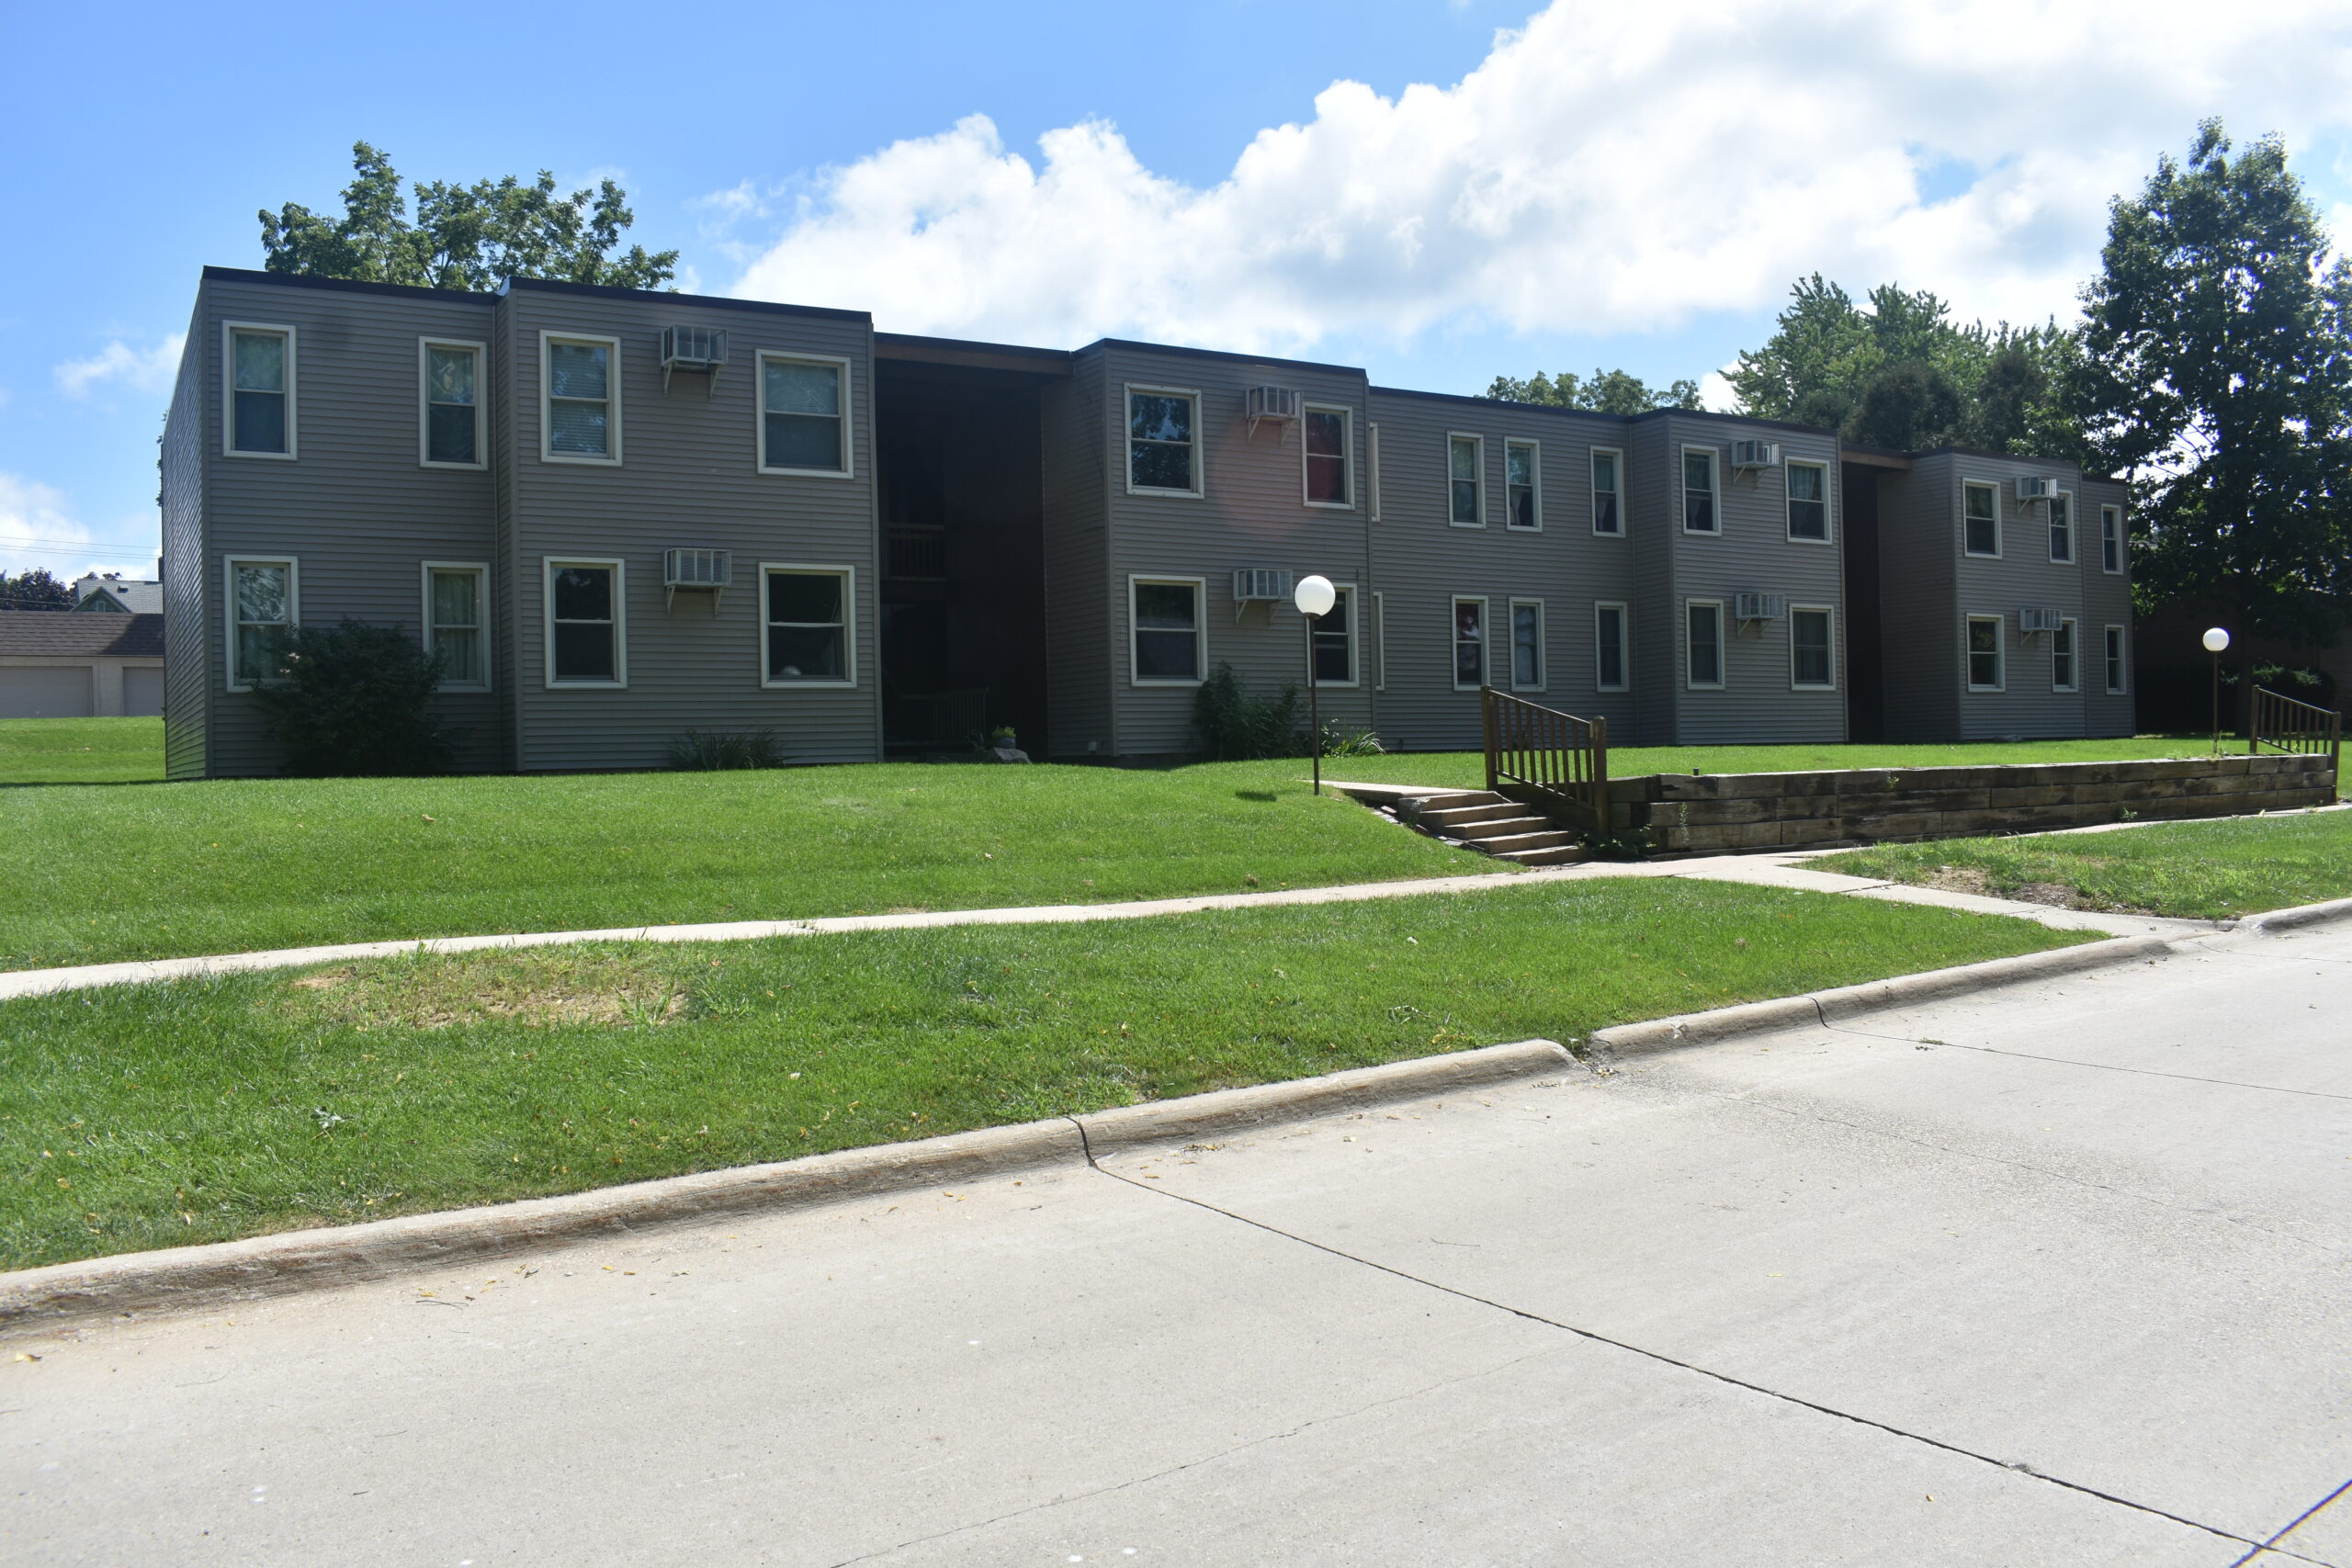

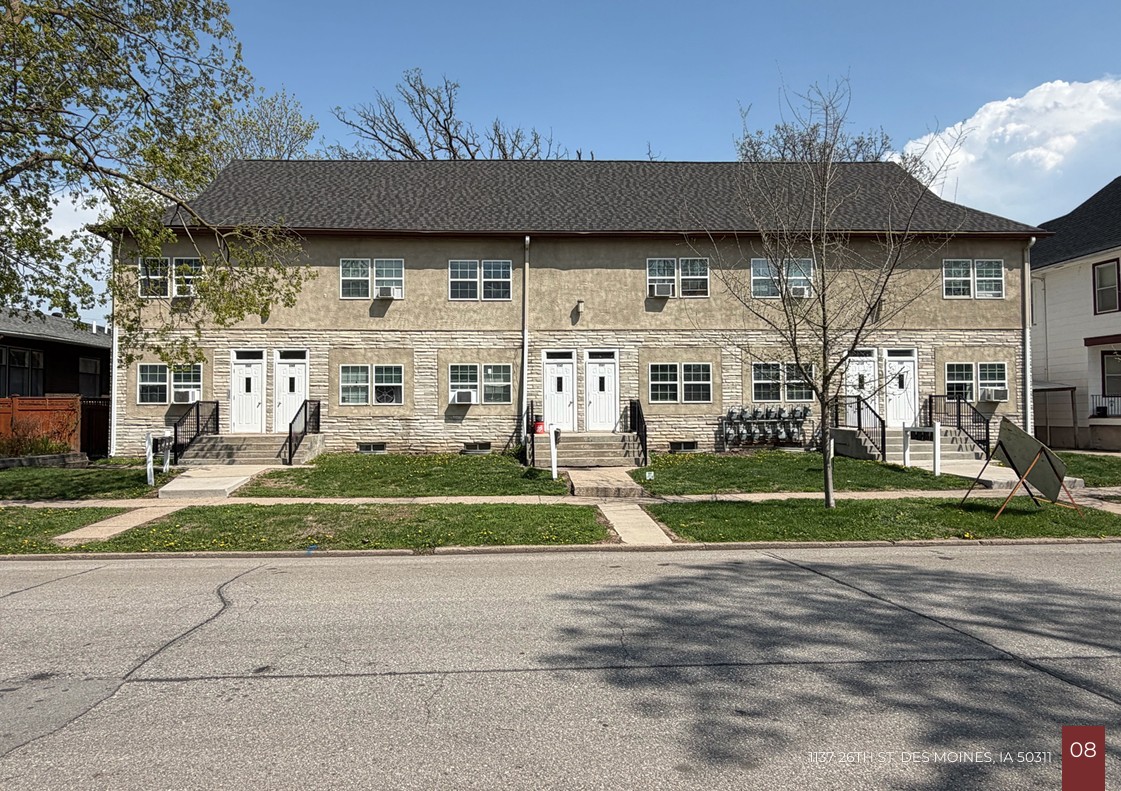
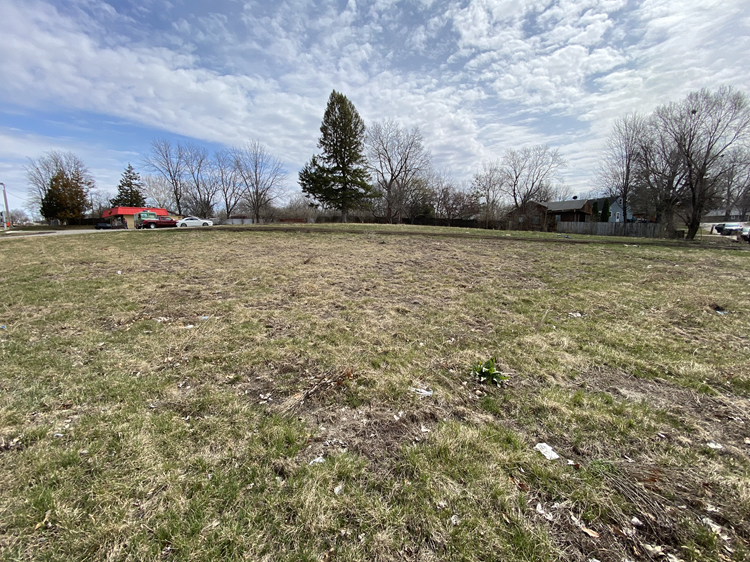
SOLD

2020 SE 44th CT. Grimes, IA
For more information on Listed, Sold, or Sale Pending properties please contact me! Thank you.
Disclaimer
Provider is a licensed real estate agent and has the rights to sell real estate in the state of Iowa.
All information was obtained via 3rd parties including but not limited to Yardi Matrix, Iowa-Leading Economic Indicators, CoStar, and more. All effort was made to ensure the accuracy, timeliness, and completeness of information provided for publication. KW Commercial does not guarantee, warrant, or represent that all information is accurate or complete and is not liable for any loss, claim, or demand arising from the direct or indirect use or reliance upon information provided.
Behind the Desk
Jared is a 3rd generation real estate entrepreneur growing up with a grandfather who was a homebuilder and investor; a father who was an electrician, developer, and investor; and a mother who was a residential investor, manager, and bookkeeper. With this extensive knowledge as well as being an owner himself for over 15+ years and involved in over 200+ individual transactions he has extensive experience in; financing, operations, management, development, construction, bookkeeping, brokerage, and entrepreneurial activities.
Having helped clients purchase and sell over $100+ Million of real estate personally as an agent-advisor Jared has helped his average client earn over 26.95% rate of return on their real estate investments.
In his spare time has has many hobbies which include but are not limited to: traveling, mountain climbing, hiking, piano, ballroom dancing, Latin dancing, pilot, Spanish lessons, and is always looking for a new adventure.