


Thoughts From Jared
“What year is it?”
Lately I’ve been asking this of anyone who has lived through a full real estate cycle. The answers vary, but a surprising number land somewhere between 2008 and 2012. For sellers and real estate professionals, those were hard years. They were also years that created real opportunity for buyers with cash or access to credit.
What I know for certain is that interest rates are at levels we haven’t seen in over 25 years, and the whole market is learning to live with them. What comes next? In my opinion, I think we are in a great reset, and that when this settles, pricing will look more like the late 1990s and 2000s than the last decade. For commercial real estate, that likely means cap rates of 8%–10% becoming common again, with debt holding around 7% or below.
If you own commercial property none of this is fun, and I’m in the same group as you as an owner so I understand the pain. Values are dropping, net worth is dropping, and cash flow may disappear in a refinance, even when you bought right and managed well. If you’re buying, this is the kind of market where the work you do on each deal matters most. Look past the cap rate and the price, and ask what actually makes a property a strong buy, a good value-add, or an operational turnaround.
One thing I do know for certain: cycles pass, and this one will too. In the meantime, the data is worth watching closely, so let’s see what it’s telling us about Iowa multifamily… buckle up, it’s going to be a wild ride!


Executive Summary
Central Iowa Statistics at a Glance
Q2 2026
- 9 closed sales
- $27.7M total volume
- Avg $/Unit: $99, 659 · Median $/Unit: $66,818
- Avg Cap Rate: 7.44%
Q3 2026
- 11 closed sales + 1 BTR Portfolio
- $18.9M standard sales · $87.3 M include
- Avg $/Unit: $84, 387 · Median $/Unit: $80,000
- Avg Cap Rate: 6.92%
ALL TRACKED IOWA MARKETS · Q3 2026
20 priced sales · $49.3M ($117.7M incl. BTR portfolio) · 667 units · Avg $/Unit $79,466 · Median $70,192 · Avg cap 7.14%
DSM 11 · Rural 6 · Sioux City 2 · Waterloo 1 · Cedar Rapids, Iowa City, Quad Cities 0. 7 more closings (about 236 units) had no confirmed price and are excluded.
DSM Pricing by Building Class · Q3 and 2026 YTD
| Class | #Sales | Q3 Avg $/Unit | Median %/Unit | YTD Sales | YTD Avg $/Unit | YTD Median | YTD Avg Cap | Note |
|---|---|---|---|---|---|---|---|---|
| A | 1 | $134,678 | $134,678 | 3 | $185,044 | $178,788 | 6.95% | Q3 = one 8-unit, 2024 built sale. Waukee BTR portfolio excluded. |
| B | 2 | $129,216 | $129,216 | 4 | $96,062 | $94,330 | 8.00% | Q3 avg driven by Ankeny 53-unit (1998-built) at $149,057/unit. |
| C | 7 | $71,688 | $78,125 | 15 | $71,407 | $78,125 | 7.03% | Q3 range: $50,000 (Newton) to $83,333 (Ankeny) per unit. |
| D | 1 | $33,333 | $33,333 | 1 | $33,333 | $33,333 | – | One 12-unit, 1967-built sale — lowest $/unit of the quarter. |
Cap Rate Trend · DSM Market · Annual Median
| 2018 | 2019 | 2020 | 2021 | 2022 | 2023 | 2024 | 2025 | 2026 YTD* |
|---|---|---|---|---|---|---|---|---|
| 8.85% | 7.53% | 7.63% | 6.65% | 6.65% | 7.81% | 6.23% | 6.63% | 7.64% |
Three Things to Consider · Q3 2026
| BUYING · ACQUIRING | HOLDING · REFINANCING | SELLING · DISPOSING |
|---|---|---|
| Underwrite debt at today’s rate at minimum. The 10 year closed September at 5.29%. | Re-run your tax line. Iowa’s new multi-residential class phases in higher assessed values over three years. | Active listings tracked: 64, double the 32 at our Q2 report. DSM alone went from 11 to 24. |
| Trades are clearing in older C-class at $50K–$83K per unit. Confirm insurance and financing before you bid. | Operations and NOI protection decide who refinances. | The three sales with confirmed asking prices closed at 94% 98% of ask. Price to the trades, not to 2021–22. |
Questions I Am Asking · Q3 2026
| BUYERS | SELLERS |
|---|---|
| With the 10-year above 5%, does this deal still work on in-place NOI — not pro forma? | If your price still assumes 2021 22 value, what is your plan if it does not sell in 90 days? |
Active Inventory vs. Sales Volume
| Market | Active Lists | Active Units | Avg List $/Unit | Q3 Sales | Q3 Volume | Avg Sold $/Unit | Avg Cap Rate |
|---|---|---|---|---|---|---|---|
| DSM | 24 | 1,216 | $74,454 | 11 | $18.9M | $84,387 | 6.92% |
| Rural | 12 | 321 | $111,709† | 6 | $11.8M | $73,255 | 8.06% |
| Quad Cities | 9 | 303 | $64,974 | 0 | – | – | – |
| Sioux City | 4 | 169 | $128,542† | 2 | $17.9M | $79,512 | – |
| Waterloo | 3 | 90 | $53,385† | 1 | $0.8M | $62,500 | – |
| Cedar Rapids | 5 | 283 | $64,479† | 0 | – | – | – |
| Iowa City | 7 | 117 | $134,059† | 0 | – | – | – |
| Total | 64 | 2,499 | 20 | $49.3M | $79,466 | 7.14%* (n=5) |
MARKET COMMENTARY
DSM
DSM recorded 11 priced sales for $18.9M in Q3, plus a two-property Waukee build-to-rent portfolio at $68.4M ($271,429/unit) that lifts the quarter to $87.3M. Strip out that one deal and the quarter is small-asset driven: 7 of the 11 sales were 12 units or fewer, and five were in Ankeny. Median price was $80,000 per unit. The three sales with a confirmed ask closed at 93.8%–98.3% of list. Meanwhile active DSM inventor more than doubled from 11 listings at our Q2 report to 24 (1,216 units), including three unpriced CBRE call-for offers totaling 390 units.
Rural Iowa
Rural Iowa posted 6 priced sales for $11.8M (191 units) at a median of $59,244 per unit, against 12 active listings (321 units). Dubuque led with three sales, 94 units and $6.8M. The one confirmed rural cap rate was Marshalltown at 8.06%. The gap between asks and closings is widest in newer construction: four 2023–2025-built Class A listings asking $115K–$240K per unit have not traded. Details on the next page.
Sioux City · Waterloo
Sioux City went from no closings in Q2 to two in Q3: 245 units and $17.9M, the largest non-DSM volume of the quarter ($57,862 and $101,163 per unit). Waterloo had one sale, a 12-unit asset at $62,500 per unit. Both markets still carry few priced listings.
Cedar Rapids · Iowa City · Quad Cities
No closings appeared in the tracker for these markets. Cedar Rapids has 5 listings (283 units), led by a 181-unit, 2025-built Class A asset listed in September without a price. Iowa City grew from none at our Q2 report to 7 listings (117 units), including a 2026-built 29-unit asset asking $8.5M ($293,103/unit). Quad Cities has 9 listings (303 units) at an average ask of $64,974 per unit.
Q3 statistics cover closings dated July 1 through October 1, 2026. Q2 was published with 9 DSM sales and $27.7M; the tracker now holds 11 qualifying Q2 DSM sales and $29.3M as later closings were confirmed. Expect Q3 to move the same way. Non-DSM sales added from a CoStar export dated Oct 6, 2026.
Rural & Other Iowa Markets
Q3 2026 · Closings Outside the DSM Core
Q3 Closings by Market
| Market | Priced Sales | Units | Volume | Avg $/Unit | Median $/Unit | Avg Cap Rate | Closings w/o Price |
|---|---|---|---|---|---|---|---|
| DSM | 11 | 219 | $18.9M | $84,387 | $80,000 | 6.92% | 3 Unpriced |
| Rural | 6 | 191 | $11.8M | $73,255 | $59,244 | 8.06% | 4 unpriced |
| Sioux City | 2 | 245 | $17.9M | $79,512 | $79,512 | – | none |
| Waterloo | 1 | 12 | $0.8M | $62,500 | $62,500 | – | none |
| Cedar Rapids | 0 | 0 | – | – | – | – | none |
| Iowa City | 0 | 0 | – | – | – | – | none |
| Quad Cities | 0 | 0 | – | – | – | – | none |
| All Markets | 20 | 667 | $49.3M | $79,466 | $70,192 | 7.14% (n=5) | 7 unpriced |
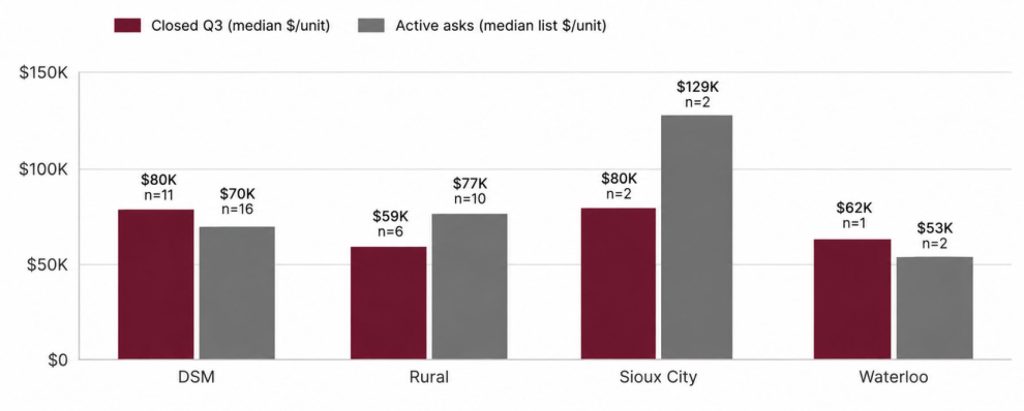
Closed vs. Asking · Median $ per Unit
What We Are Seeing Outside DSM
Sioux City is the story of the quarter.
We reported no Sioux City closings in Q2. Q3 brought two: Country Estates of Morningside (159 units, 1968-built) at $57,862 per unit and Martin Tower on the Mall (86 units, 1912-built Class B) at $101,163, together $17.9M and 245 units. The one newer Sioux City asset on the market, a 24-unit 2023-built property, is asking $177,083 per unit.
Rural pricing clusters at $40K–$65K per unit. All 6 priced rural sales were Class C. The median was $59,244 per unit, or $57,377 without the 1858 built Dubuque historic rehab at $160,714 per unit, whose price reflects the rehab. The 61-unit Wingate Dr. sale in Dubuque is a senior LIHTC community, so its restricted rents make it a weaker market-rate comparable. Keokuk printed the low end again: 48 units at $39,677 per unit, after a 16-unit Keokuk sale at $47,500 in Q2.
Dubuque led rural volume. Three sales (94 units, $6.8M) were 58% of rural dollars, ranging from $55,263 to $160,714 per unit.
Q3 2026 Closed Sale Comps
Rural & Other Iowa Markets · KataLYST Tracker
| Market | Address | Units | Class | Built | Cap Rate | Sale Price | $/Unit | Notes |
|---|---|---|---|---|---|---|---|---|
| Waterloo | 1110 Doreen Ave | 12 | C | 1969 | – | $750,000 | $62,500 | Jul 17 · Tracker ask $745K; closed about 100.7% of ask |
| Rural – Algona | 1906 90th Ave | 13 | C | 1940 | – | $850,000 | $65,385 | Jul 22 · 1940-built; about 71% of $1.2M tracker ask |
| Sioux City | 1331 S Maple St | 159 | C | 1968 | – | $9,200,000 | $57,862 | Jul 23 · Country Estates of Morningside |
| Rural – Keokuk | 128 Bank St | 48 | C | 1982 | – | $1,904,500 | $39,677 | Jul 29 · River Terrace Apts; lowest rural $/unit |
| Rural – Dubuque | 1199 Central Ave | 14 | C | 1858 | – | $2,250,000 | $160,714 | Jul 31 · Historic rehab (1858-built) |
| Sioux City | 400 Pierce St | 86 | B | 1912 | – | $8,700,000 | $101,163 | Aug 11 · Martin Tower on the Mall |
| Rural – Dubuque | 2535 Central Ave | 19 | C | 1920 | – | $1,050,000 | $55,263 | Aug 11 · Closed at tracker ask of $1.05M |
| Rural – Marshalltown | 611 E South St | 36 | C | 1965 | – | $2,200,000 | $61,111 | Sep 14 · South Street Apts; confirmed in-place cap |
| Rural – Dubuque | 1401 Wingate Dr | 61 | C | 2011 | – | $3,500,000 | $57,377 | Sep 15 · Senior LIHTC community (restricted rent) |
Closings Identified · Pricing Unconfirmed (Excluded from Statistics)
| Closed | Property | City | Units | Status |
|---|---|---|---|---|
| Jul 1 | 301 W Day Spring Ln | Decorah | 15 | 1900-built, Class C; price not confirmed |
| Aug 14 | 107 Homer St SE | Shellsburg | 8 | 1977-built, Class C; price not confirmed |
| Sep 8 | 414 7th St SE | Oelwein | 8 | 1977-built, Class C; price not confirmed |
| Sep 8 | 400 13th Ave NW | Oelwein | 36 | 1999-built, Class B; price not confirmed |
Asking Prices vs. Closings Outside DSM
- Most listings that traded did so near ask. Of four tracker listings that closed in Q3, three (Marshalltown, Dubuque’s 2535 Central Ave. and Waterloo’s Doreen Ave.) closed within 1% of their tracker asking price. The Algona property closed at about 71% of ask.
- New construction is where asks and closings diverge. Active rural Class A asks (Chariton, Marshalltown, Monticello, Van Meter) run $115K–$240K per unit. No rural sale in Q3 was newer than 2011, and the median rural Class C ask ($65,278, n=5) sits about 14% above the Class C closings ($57,377).
- Rural cap rates are running wider. Marshalltown’s 8.06% in-place cap is the only confirmed non-DSM cap this quarter. In Q2 the one rural cap was 9.04% (West Burlington). Against DSM’s Q3 average of 6.92%, that is roughly 115 basis points wider, from very small samples.
- Visibility is thin. 4 of 13 non-DSM closings in the export had no disclosed price (Oelwein ×2, Shellsburg, Decorah). The tracker reflects KataLYST research and CoStar and may not capture every transaction in smaller markets.
Iowa Economy – Q3 2026
Iowa Leading Indicators Index (ILII) · May – July 2026
| Month | ILII Reading | Mo. Change | Diffusion Index | 6-Mo. Ann. Rate | Key Signal |
|---|---|---|---|---|---|
| May 2026 | 108.7 | 0.30% | 75 | 2.20% | 6 of 8 components ↑; permits −10.9% YoY; corn and soybean profit indexes +10.6% / +14.7% YoY |
| Jun 2026 | 108.5 | −0.1% | 50 | 1.40% | 4 of 8 components ↑; permits 1,411 vs. 1,688 a year ago (−16.4%); nonfarm jobs down 21 of last 22 months |
| Jul 2026 | 109 | 0.60% | 93.8 | 1.90% | All 8 components ↑; permits 1,512 (+55.4% YoY); nonfarm jobs flat in July, down 22 of last 23 months |
What the ILII Is Telling Us · Q3 2026
The index ended the quarter at 109.0 in July, higher than any reading in our last two quarterly reports (107.6 to 108.3). July was also the broadest reading in our reports since February: all eight components rose and the monthly diffusion index jumped from 50.0 in June to 93.8. The six-month annualized rate is +1.9%, far from the −2.0% level that would flag contraction risk. Iowa’s economy is still growing, slowly.
Last quarter we asked whether April’s permit rebound would hold. It did not: permits were down 10.9% year over year in May and 16.4% in June, then jumped 55.4% in July to 1,512 units, 43.3% above the historical monthly average. One strong month does not make a trend, but a supply pipeline that swings this much is worth watching for Q4 and 2027 deliveries.
The tension from Q2 is still there. The leading index is above 100 and rising, yet the Iowa nonfarm employment index has fallen in 22 of the last 23 months. In August, Iowa Workforce Development reported 2,400 jobs added (total nonfarm 1,585,800), led by 1,300 manufacturing jobs. That is encouraging, but one month of gains does not yet change the rent-growth story for multifamily operators.
Iowa Economic Indicators · Q3 2026
| Indicator | Reading | As Pf | Source | Implication |
|---|---|---|---|---|
| Iowa Unemployment Rate | 3.20% | Aug 2026 | Iowa Workforce Dev. | ↓ from 3.5% a year ago; unchanged from July |
| US Unemployment Rate | 4.20% | Sep 2026 | BLS | Up from 4.1% in August; only 29,000 jobs added in September |
| Iowa LFPR | 67.00% | Aug 2026 | Iowa Workforce Dev | Down from 67.1% in July and 67.4% in May |
| Iowa Nonfarm Jobs | 2400.00% | Aug 2026 | Iowa Workforce Dev | Total 1,585,800; manufacturing +1,300 |
| 10-Year Treasury | 5.29% | Sep 30, 2026 | Federal Reserve (H.15) | Crossed 5% on Sep 14; was 4.40% in our Q2 report. Our Q3 DSM average cap (6.92%, n=4) sits about 165 bps above it |
| Iowa ILII | 109 | Jul 2026 | Iowa Dept. of Revenue | 6-mo. annualized +1.9%; all 8 components ↑; no contraction signal |
Iowa Property Taxes · The Law Is Now Signed
| Provision | What the signed law (SF 2472) does |
|---|---|
| Multi-residential class | Re-establishes a separate property class for apartment buildings and increases their assessed value over three years. |
| Local revenue cap | Caps city and county general-levy revenue growth at 2% beginning in fiscal 2027–28 (school funding excluded). |
| TIF | Limits tax-increment financing agreements to 23 years, which affects the structure of financed rehab and development deals. |
| Why it matters | Taxable value on apartments steps up while rents are flat. Rebuild the tax line in your pro forma using the new class and phase-in, and confirm the details with your tax advisor. |
What I’m Watching · What I’m Hearing · What I’m Seeing
| WATCHING | HEARING | SEEING |
|---|---|---|
| The 10-year Treasury. It crossed 5% on Sep 14 and closed the quarter at 5.29%. | While it appears there is less pain in the market with strong cap rates and strong ask prices; the number of listings continue to push it into a buyer’s market and a forecast of reduced prices going forward. | Active listings in our tracker: 64, up from 32 at our Q2 report. |
| Iowa property tax implementation of the new law. | Large institutions are underwriting new debt at 10% | Unpriced, call-for-offers marketing on larger DSM assets. |
| Whether July’s permit surge repeats. | Quality tenant applications continue to deteriorate | Rural new-construction asks still waiting for a buyer. |
National Economy · Multifamily Market
Q3 2026
National Multifamily
National Multifamily Narrative
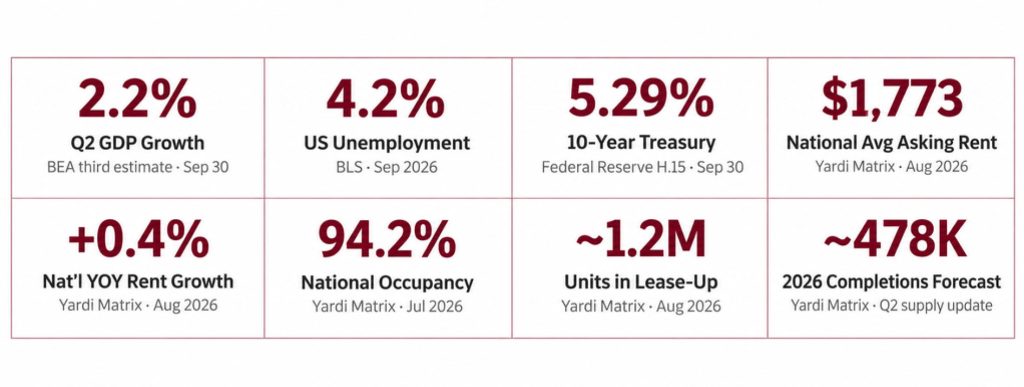
The national multifamily market spent the summer inching out of its slump. Yardi Matrix reported that average asking rents reached $1,773 in August, up $2 from July and 0.4% above a year ago, the strongest annual growth in nearly a year and the sixth straight monthly increase. Yardi describes a “firming rent environment.” Occupancy was 94.2% in July, still 0.5% below a year earlier.
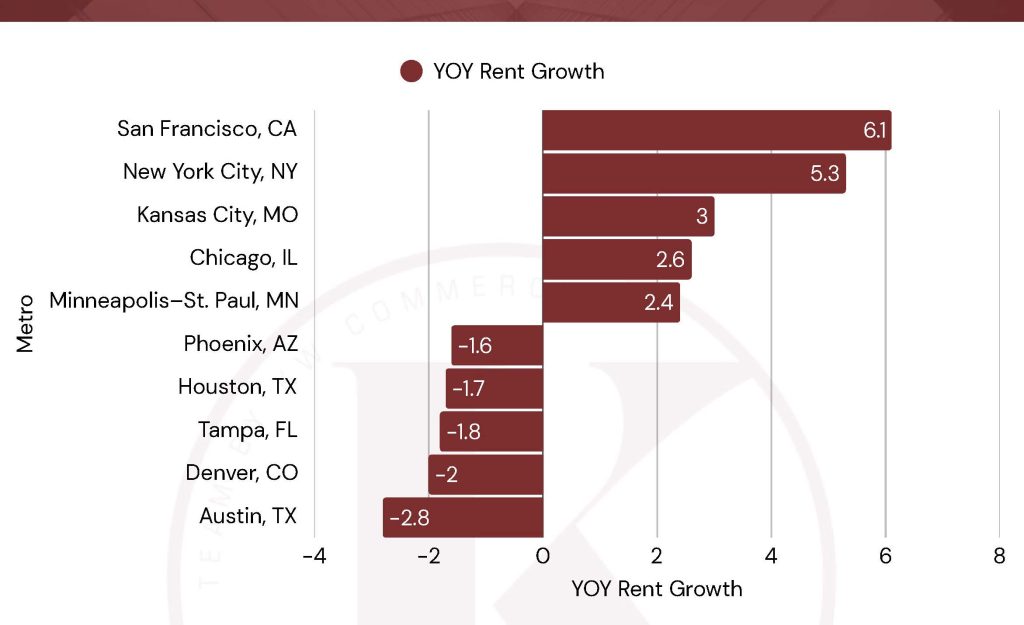
Supply is the reason for the improvement. Starts and deliveries are down about one-third from their 2023–24 peak, and the lease-up pipeline has fallen from 1.4 million units to about 1.2 million. High supply Sun Belt markets are stabilizing: Austin’s annual rent decline has narrowed from −5.8% in our Q2 report to −2.8%, while Midwest and gateway markets such as Kansas City (+3.0%), Chicago (+2.6%) and the Twin Cities (+2.4%) keep leading the country.
The capital-markets story changed more than the rent story. The 10-year Treasury crossed 5% on September 14 and ended the quarter at 5.29%, its highest level in nearly two decades and nearly a full point above where it stood at our Q2 report. Higher rates, not weaker demand, are now the main pressure on pricing and refinancing. Stabilizing rents do not offset an exit cap rate that has to compete with a 5%+ risk-free yield.
Metro Rent Growth Leaders
August 2026 · Yardi Matrix
How Do You Profit? · National Context
| BUYING · ACQUIRING | HOLDING · REFINANCING | SELLING · DISPOSING |
|---|---|---|
| Supply is rolling over. Starts and deliveries are down about a third from the 2023–24 peak. | The 10-year at 5.29% resets refinance math for anyone who bought in 2021–22. | Rent growth is positive again nationally, but exit pricing must clear a higher rate. |
| Long term the US is still short of housing. If you can look past the next 3–5 years, you can find value. | Lenders are lending, but DSCR matters more than ever. | Stabilized Midwest assets still draw the most buyer interest. |
| Iowa’s B-class middle market offers risk-adjusted value, but price it off a 5%+ Treasury. | NOI protection through strong operations is the most controllable variable you have. | Distressed sellers must price for today’s underwriting. The bidask gap is the main brake on volume. |
Q3 2026 Closed Sale Comps
DSM Market · KataLYST Tracker
Central Iowa Closed Transactions
| Market | Address | Units | Class | Cap Rate | Sale Price | $/Unit | Broker | Notes |
|---|---|---|---|---|---|---|---|---|
| DSM – Perry | 2103 Willis Ave. | 8 | A | – | $1,077,425 | $134,678 | Unknown | Jul 13 · 2024-built |
| DSM – Des Moines | 1011 Park Ave. | 12 | D | – | $400,000 | $33,333 | Unknown | Jul 15 · 1967-built; lowest $/unit of the quarter |
| DSM – Ankeny | 217 NW College Ave. | 8 | C | – | $625,000 | $78,125 | Unknown | Jul 22 · 1966-built |
| DSM – Ankeny | 309 NW 18th St. | 53 | B | – | $7,900,000 | $149,057 | Unknown | Jul 31 · 1998-built; largest standard sale by dollars |
| DSM – Des Moines | 4004 University Ave. | 8 | C | 6.09% | $600,000 | $75,000 | NAI Iowa / Stanbrough Realty | Jul 31 · 93.8% of $640K ask; listed at 5.71% cap |
| DSM – WDM | 1120 5th St. | 8 | B | 8.00% | $875,000 | $109,375 | Unknown | Aug 17 · 1998-built |
| DSM – Slater | 701 Linn St. | 28 | C | – | $1,550,000 | $55,357 | Unknown | Aug 19 · Story County; within DSM 35-mile radius |
| DSM – Ankeny | 1011 SE 3rd St. | 18 | C | 5.83% | $1,500,000 | $83,333 | NAI Iowa (both) | Sep 4 · 96.8% of $1.55M ask; listed at 5.64% cap |
| DSM – Ankeny | 1114 SE Belmont Dr. | 12 | C | – | $960,000 | $80,000 | Unknown | Sep 16 · Two-property sale, 20 units at $80K/unit |
| DSM – Ankeny | 1102 SE Belmont Dr. | 8 | C | – | $640,000 | $80,000 | CBRE | Sep 16 · Two-property sale, 20 units at $80K/unit |
| DSM – Newton | 315 1st St. S | 56 | C | 7.74% | $2,800,000 | $50,000 | Unknown | Sep 16 · 98.3% of $2.85M ask; confirmed cap |
| DSM – Waukee | 865 NW Sproul Dr. & 1325 SE Centennial Pkwy. (2-property portfolio) | 252 | A | – | $68,400,000 | $271,429 (excluded) | Unknown | Aug 12 · Build-to-rent duplex/quadplex/townhome portfolio; excluded from $/unit and cap benchmarks |
Closings Identified · Pricing Unconfirmed (Excluded from Statistics)
| Closed | Property | City | Units | Status |
|---|---|---|---|---|
| Aug 4 | 701 SE 26th Ct. | Des Moines | 12 | 1969-built, Class B; price not confirmed |
| Aug 27 | 1872 NW 82nd St. | Clive | 123 | 1971-built, Class C; price not confirmed |
| Oct 1 | 325 SW 7th St. | Des Moines | – | Closing recorded; price not confirmed |
Active Listings Snapshot
| Market | Property | Units | Class | List Cap | List Price | List $/Unit | Listing Firm |
|---|---|---|---|---|---|---|---|
| DSM | 100-112 5th Ave. NW (Altoona) | 144 | C | 6.99% | $14,800,000 | $102,778 | Daymark Real Estate |
| DSM | 920 Meadow Ln | 102 | C | 7.58% | $5,900,000 | $57,843 | CBRE |
| DSM | 3909 Hubbell Ave. | 54 | C | 6.21% | $4,625,000 | $85,648 | Marcus & Millichap |
| DSM | 1420 Pennsylvania Ave. | 78 | C | 8.29% | $4,300,000 | $55,128 | CBRE |
| DSM | 3830 6th Ave. | 47 | C | 8.28% | $2,650,000 | $56,383 | CBRE |
| DSM | 3274 E. Euclid Ave. | 8 | B | 7.15% | $769,000 | $96,125 | The KataLYST Team |
| DSM | 615 Parker St. | 158 | B | – | Call for Offers | – | CBRE |
| DSM | 6300 Merle Hay Rd. (Johnston) | 195 | A | – | Call for Offers | – | CBRE |
| DSM | 1201 Center St. | 37 | A | – | Call for Offers | – | CBRE |
| Rural | 1833 Curtis Ave. (Chariton) | 52 | A | 6.74% | $6,000,000 | $115,385 | Stanbrough Realty |
| Rural | 602 Creekside Ln (Marshalltown) | 24 | A | 6.80% | $5,600,000 | $233,333 | Stanbrough Realty |
| Rural | 1115 4th St. (Mason City) | 48 | C | 7.17% | $3,300,000 | $68,750 | CBRE |
| Iowa City | 4428 Deer Creek Rd. | 29 | A | – | $8,500,000 | $293,103 | Navigate |
| Cedar Rapids | 3998-4025 Westdale Pkwy | 181 | A | – | Unpriced | – | Stanbrough Realty |
| Cedar Rapids | 16-26-76-86 Aossey Ln SW | 32 | B | 8.27% | $2,100,000 | $65,625 | Unknown |
| Quad Cities | 7118 Hillandale Rd. | 100 | C | 7.74% | $8,500,000 | $85,000 | Bang Realty |
| Quad Cities | 4406 N Division St. | 33 | C | 8.53% | $2,350,000 | $71,212 | CBRE |
| Sioux City | 1720 Morningside Ave. | 24 | A | – | $4,250,000 | $177,083 | NAI United |
| Waterloo | 765-791 Russell Rd. | 48 | C | 8.51% | $2,725,000 | $56,771 | CBRE |
What have WE been Selling and LYSTing JUST in 2026?
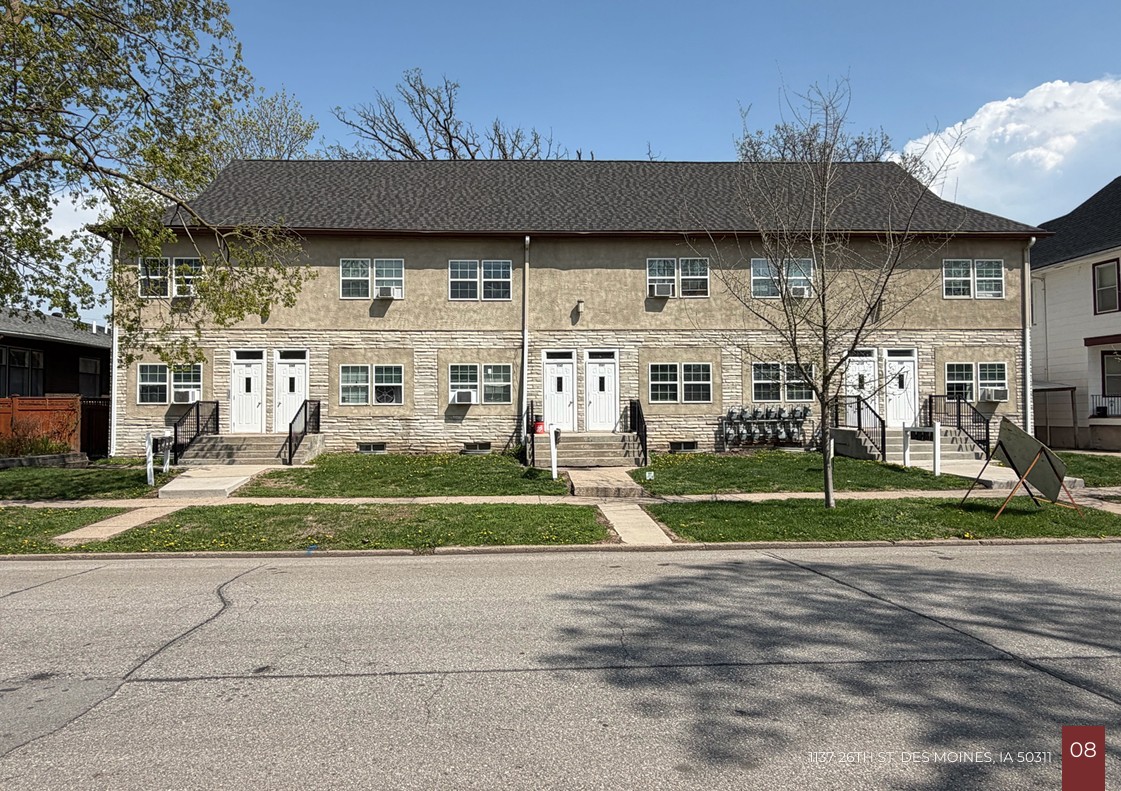


ACTIVE
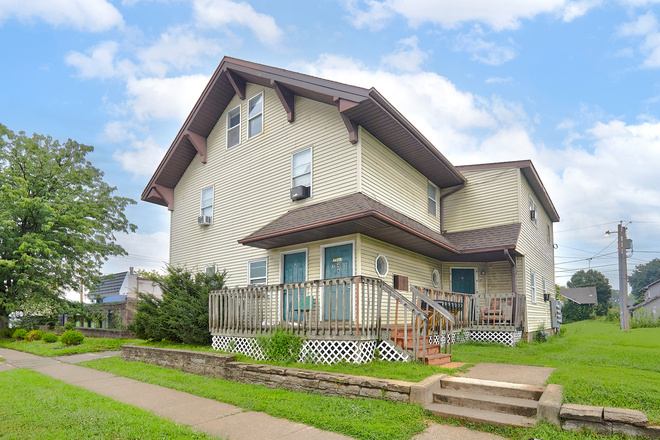
3507 2nd Ave. Des Moines, IA
ACTIVE
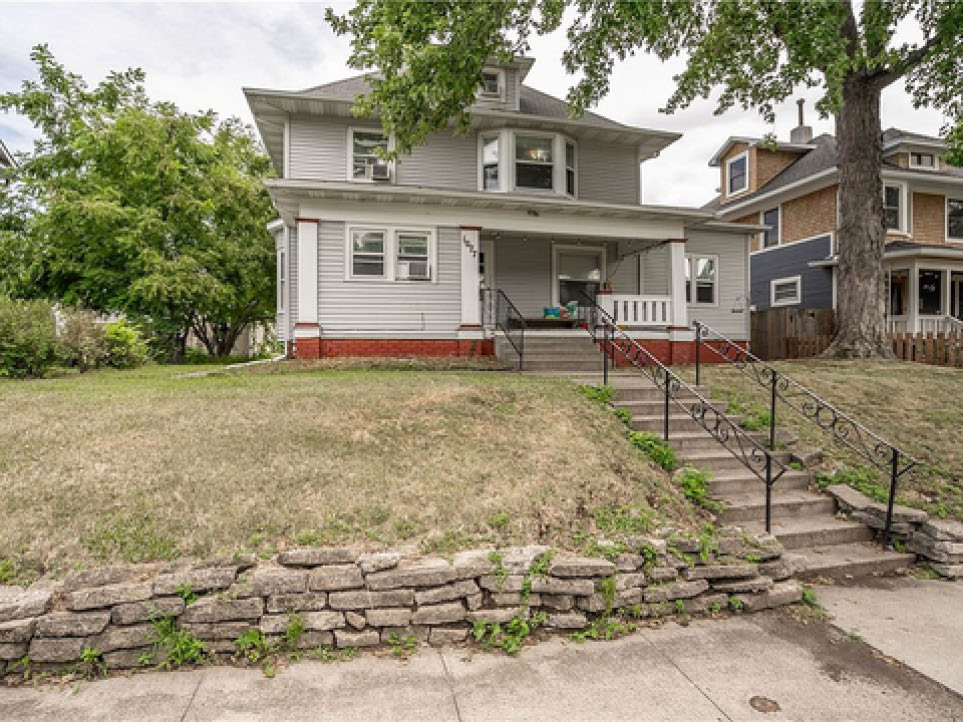
1077 27th St. Des Moines, IA
ACTIVE
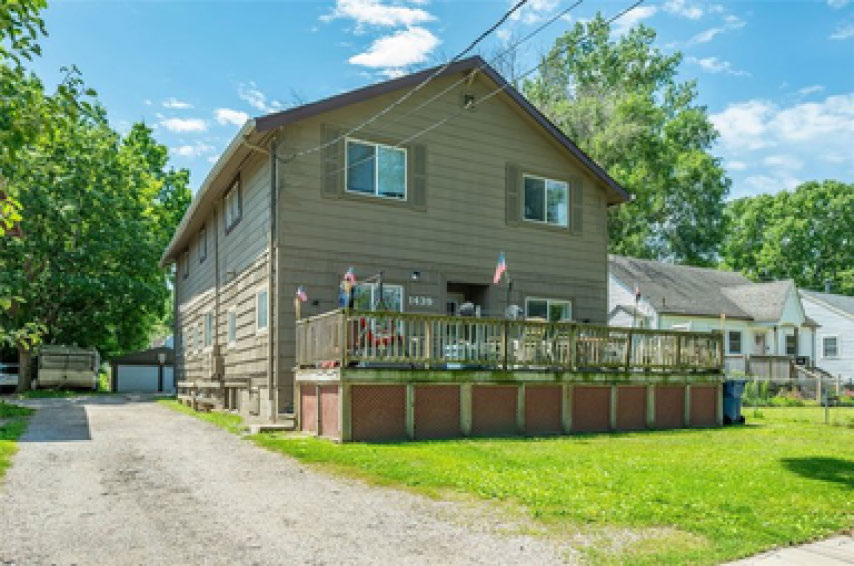
1439 Henderson Ave. Des Moines, IA
UNDER CONTRACT
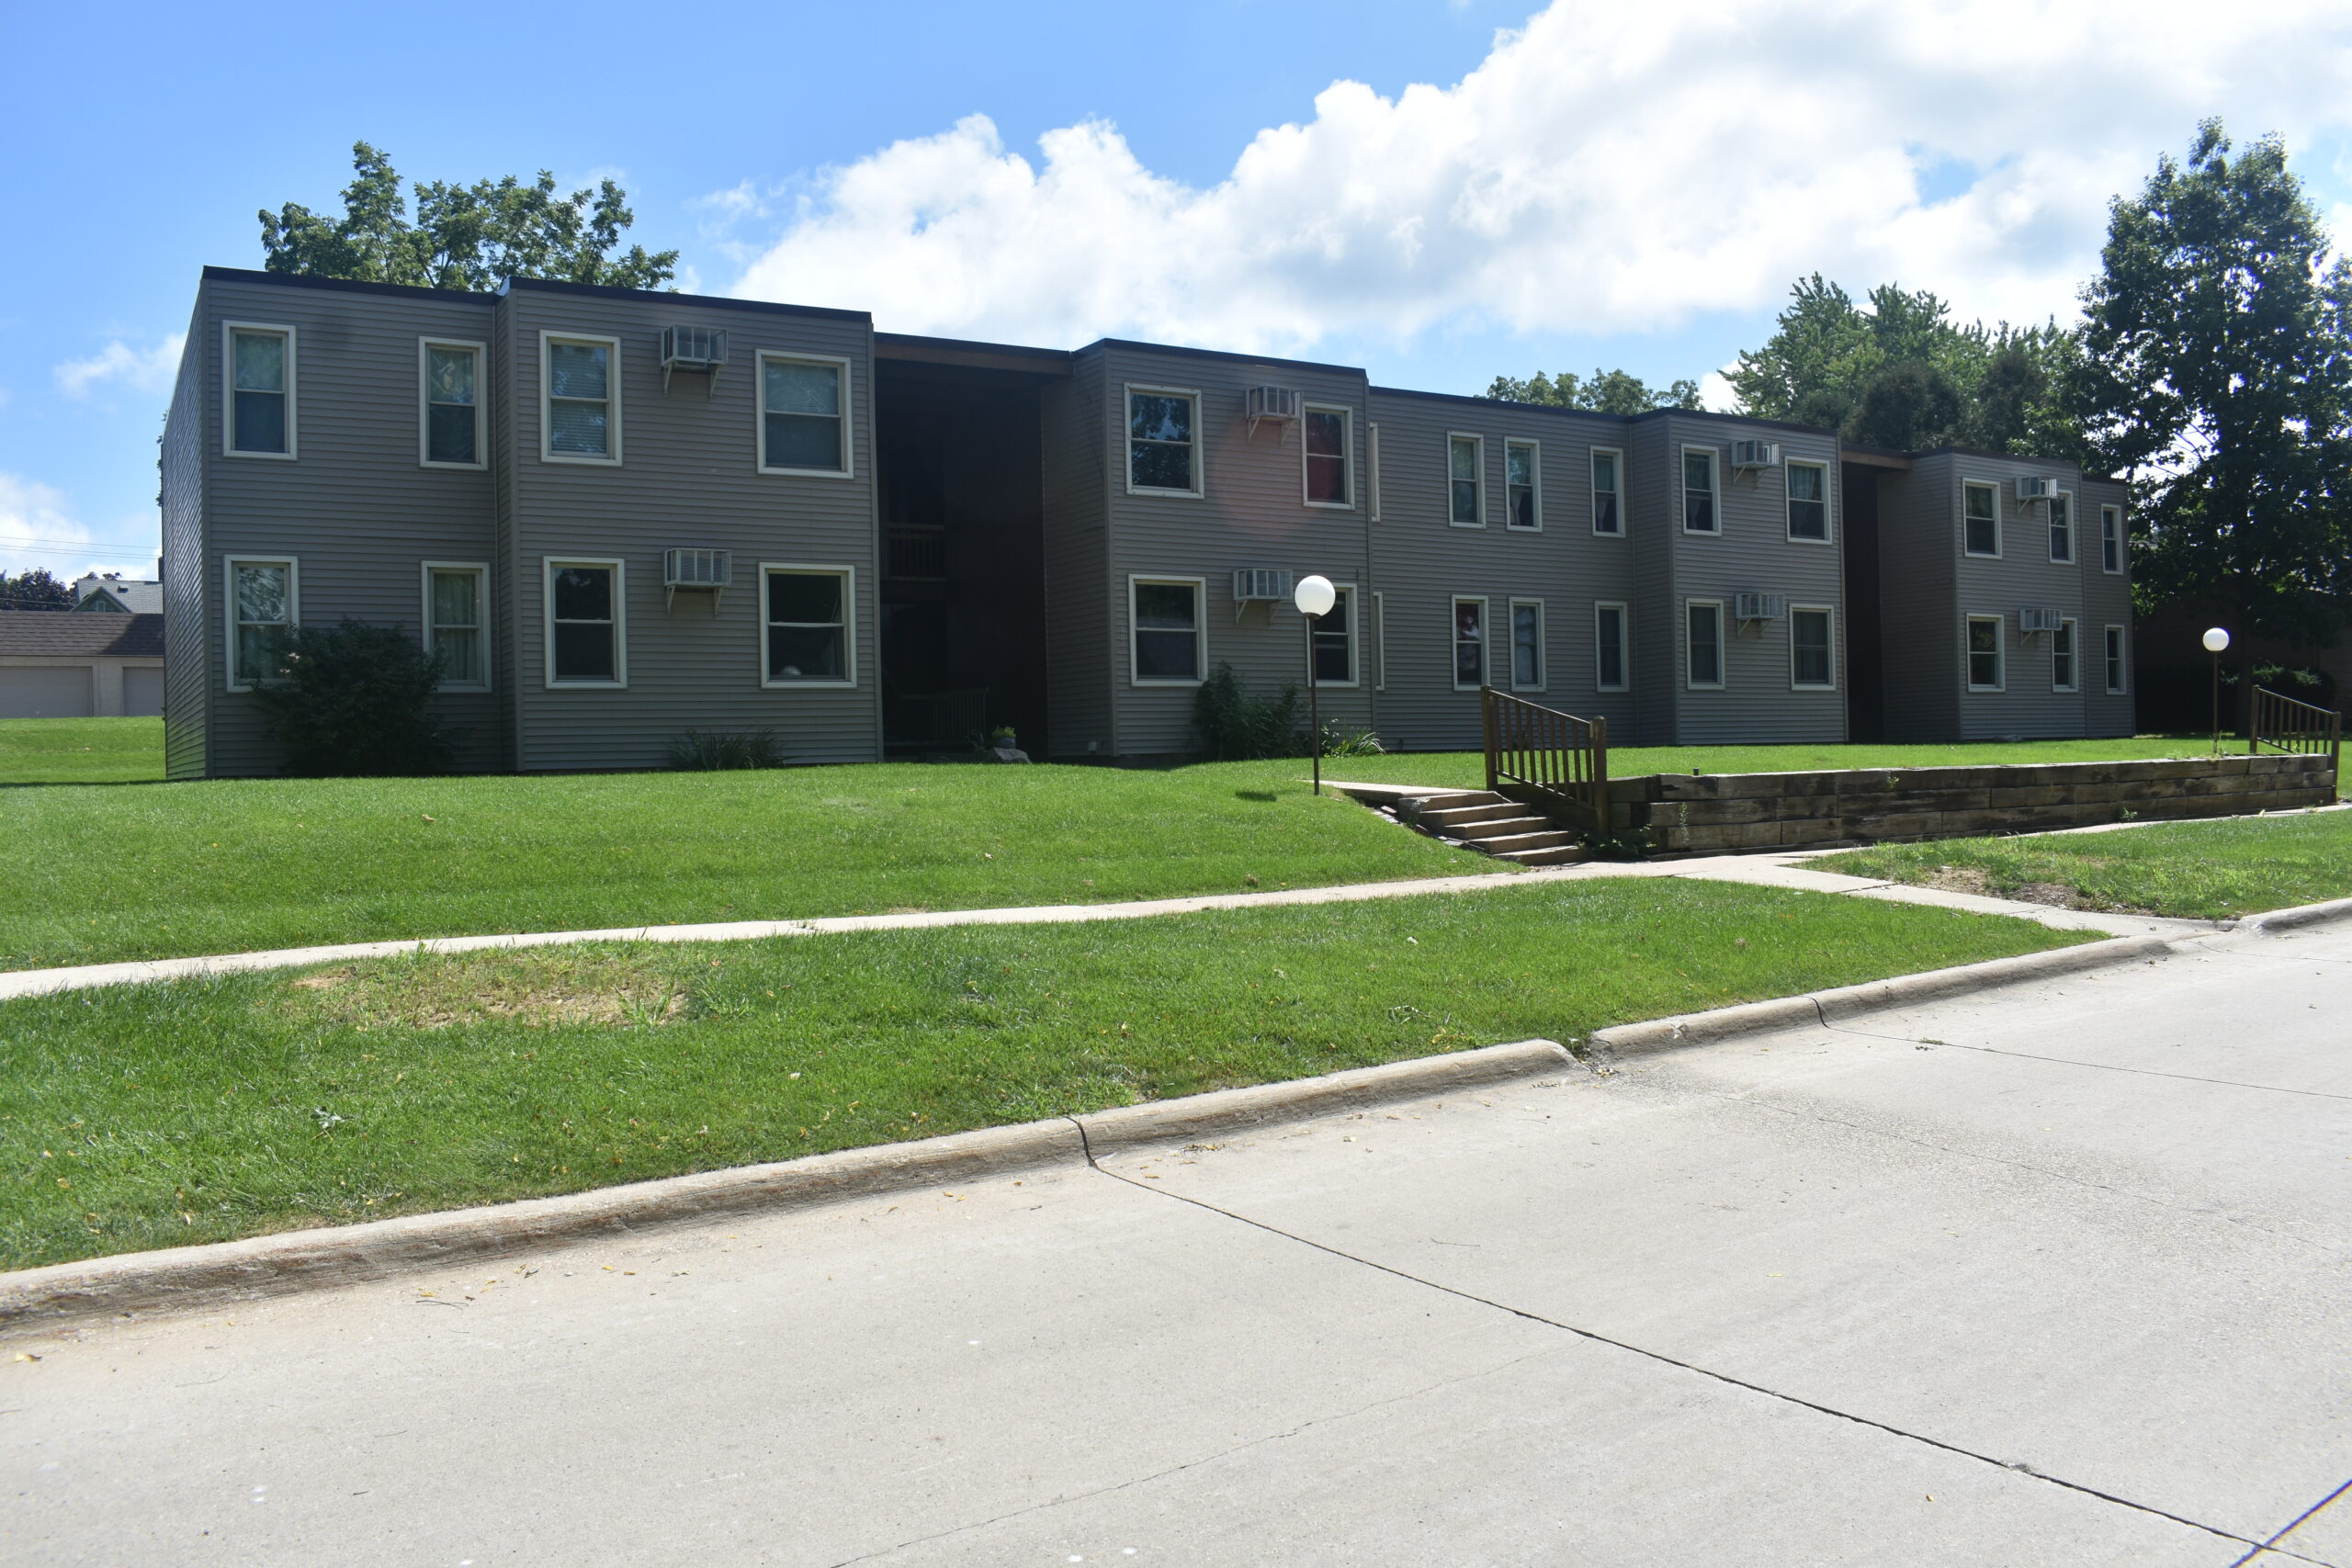
405 N. Davis St. Anamosa, IA
SOLD
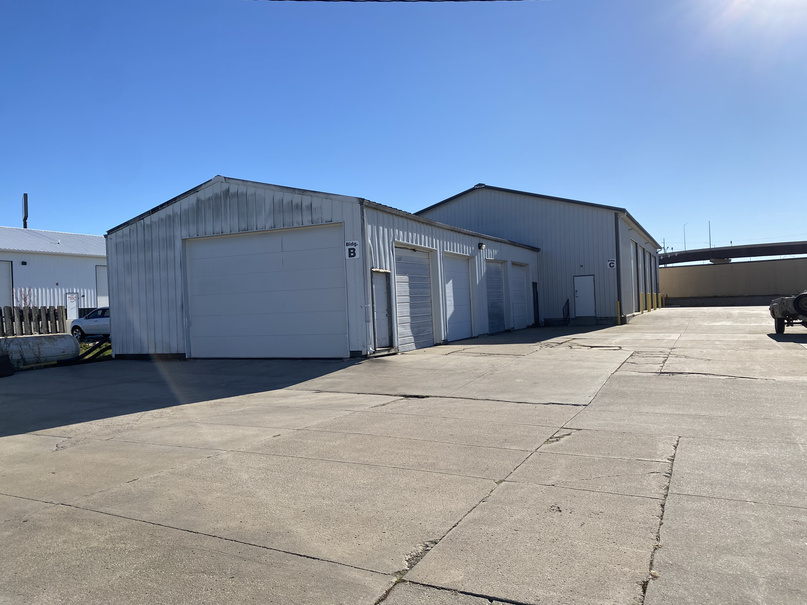
2020 44th Ct. Grimes, IA
SOLD
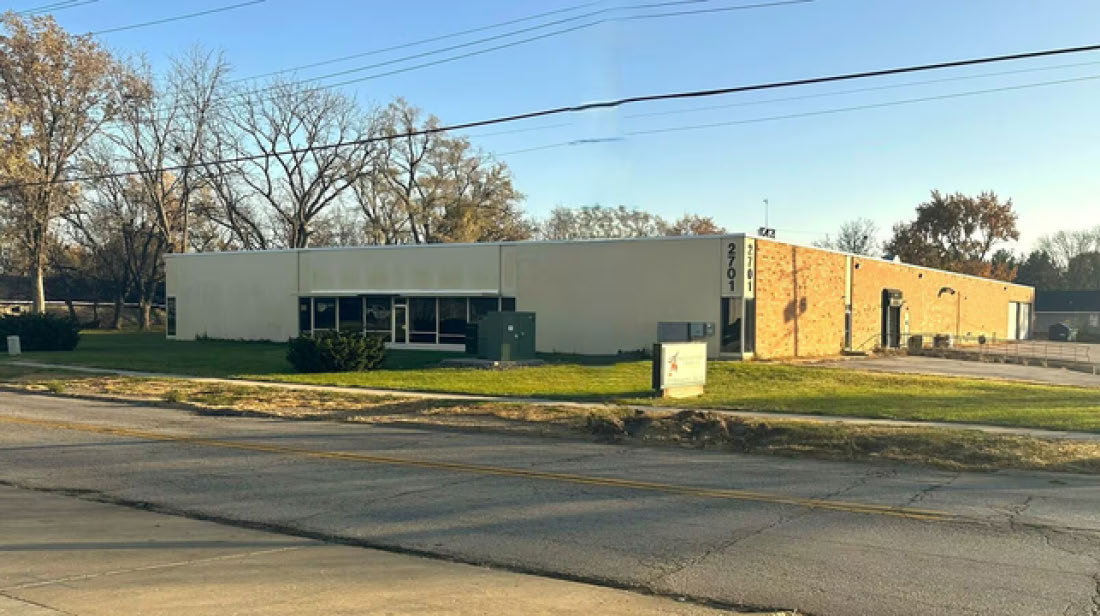
2701 Delaware Ave. Des Moines, IA
For more information on Listed, Sold, or Sale Pending properties please contact me! Thank you.
Disclaimer
Provider is a licensed real estate agent and has the rights to sell real estate in the state of Iowa.
All information was obtained via 3rd parties including but not limited to Yardi Matrix, Iowa-Leading Economic Indicators, CoStar, and more. All effort was made to ensure the accuracy, timeliness, and completeness of information provided for publication. KW Commercial does not guarantee, warrant, or represent that all information is accurate or complete and is not liable for any loss, claim, or demand arising from the direct or indirect use or reliance upon information provided.


Behind the Desk
Jared is a 3rd generation real estate entrepreneur growing up with a grandfather who was a homebuilder and investor; a father who was an electrician, developer, and investor; and a mother who was a residential investor, manager, and bookkeeper. With this extensive knowledge as well as being an owner himself for over 15+ years and involved in over 200+ individual transactions he has extensive experience in; financing, operations, management, development, construction, bookkeeping, brokerage, and entrepreneurial activities.
Having helped clients purchase and sell over $100+ Million of real estate personally as an agent-advisor Jared has helped his average client earn over 26.95% rate of return on their real estate investments.
In his spare time has has many hobbies which include but are not limited to: traveling, mountain climbing, hiking, piano, ballroom dancing, Latin dancing, pilot, Spanish lessons, and is always looking for a new adventure.